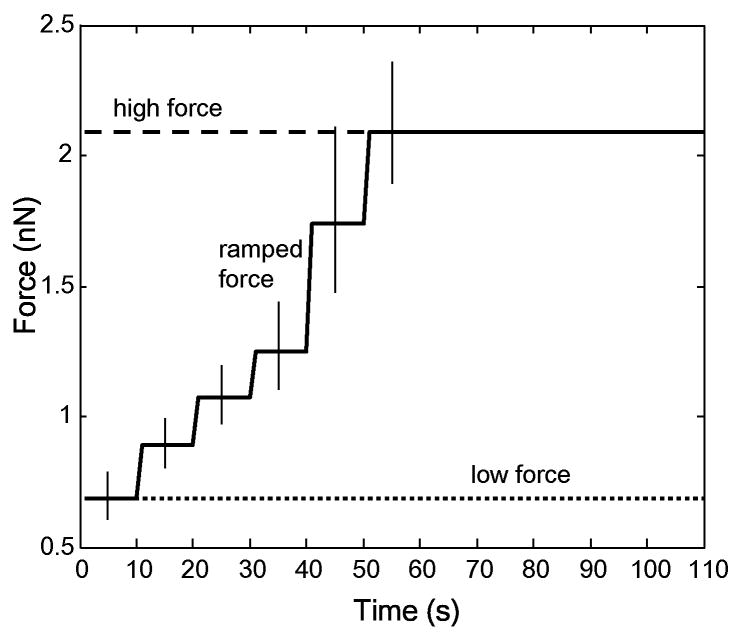
Figure 1.
Low, high, and ramped force profiles used for cell studies. Different force levels were obtained by holding the magnetic trap tip 30 μm from a bead attached to a cell and choosing currents based on trap calibration. The low and high force profiles (dotted and dashed lines respectively) were application of 0.7 nN or 2.1 nN for 110 s (corresponding to 1.0 A and 3.5 A of current, respectively). The ramped profile increased from 0.7 nN to 2.1 nN by increasing the current 0.5 A every 10s (corresponding step values are 0.7, 0.9, 1.1, 1.2, 1.7, and 2.1 nN) for 60s and then holding at 2.1 nN for the remaining 50s. For each of the six different force levels, error bars show forces correlating to a ±5 μm difference from 30 μm in placement of the magnetic trap. Force-current relationships are based on bead calibration in dimethylpolysiloxane (see Methods).

