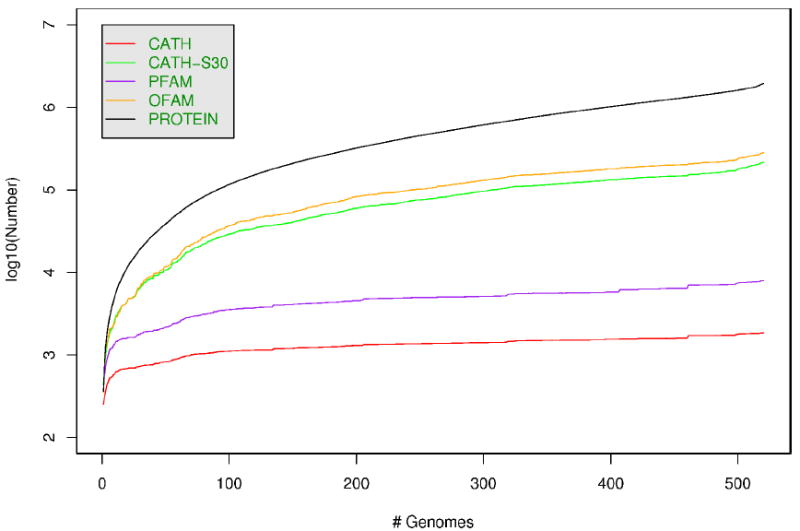
Figure 1.

This figure shows the numbers (as a log scale) of genome sequences (PROTEIN), OFAMs (putative orthologous gene families), CATH-S30 (30% non-redundant sequence families), PFAM families, and CATH domain superfamilies, as genomes are added to the database in increasing order of size.
