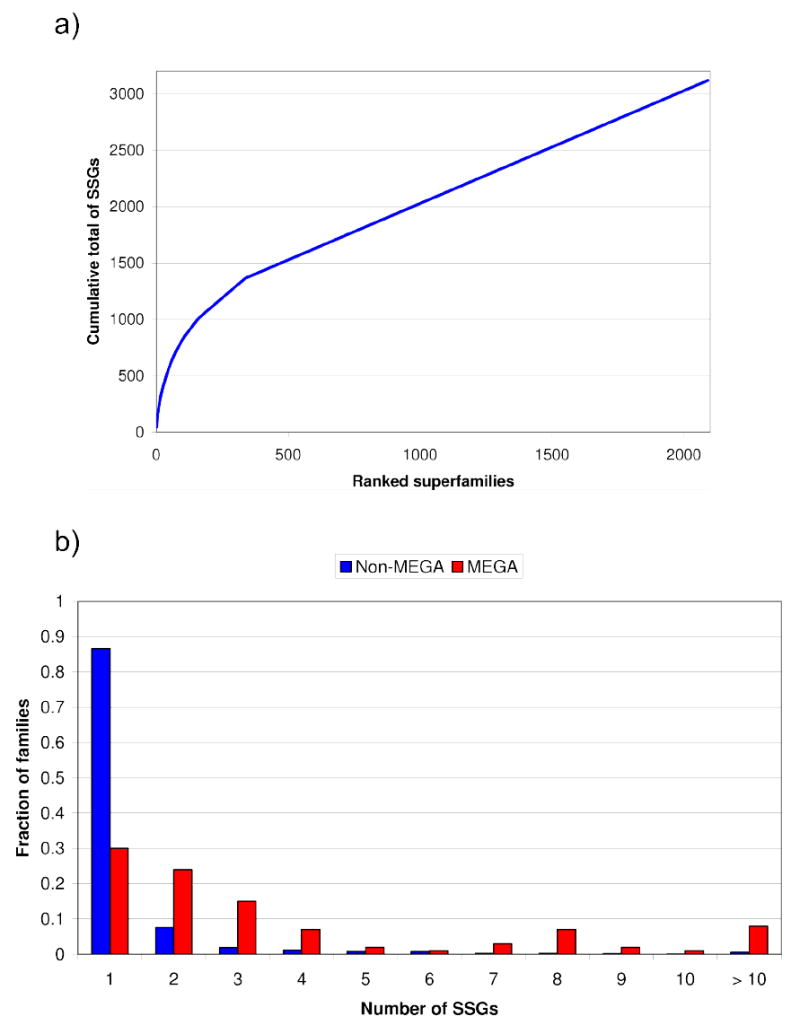
Figure 3.

a) This figure shows a cumulative plot of the percentage of structurally similar groups (SSGs) for all superfamilies in CATH, when ranked by largest to smallest. It can be seen that the top 300 CATH superfamilies (MEGA) account for ~40% of the fold groups and are hence extremely structurally diverse. b) This histogram shows the fraction of SSGs in MEGA and NON-MEGA superfamilies in CATH. It can be seen that the MEGA superfamilies have a disproportionate number of SSGs.
