
Figure 3.
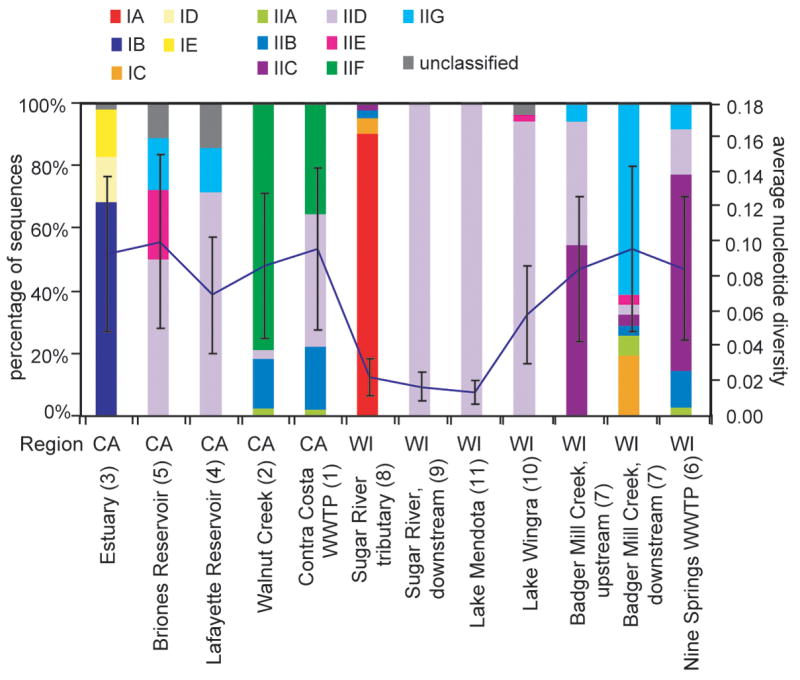
Distribution of Accumulibacter clades among samples, and average nucleotide diversity values for each ppk1 clone library. Sample location numbers corresponding to Figure 1 are shown in parentheses. Percentages represent the fraction of Accumulibacter ppk1 clones from a given library that cluster in the indicated clade, without removing duplicate or highly similar sequences. Average nucleotide diversity of ppk1 sequences in each library was calculated using Arlequin, and means +/− one standard error are shown.