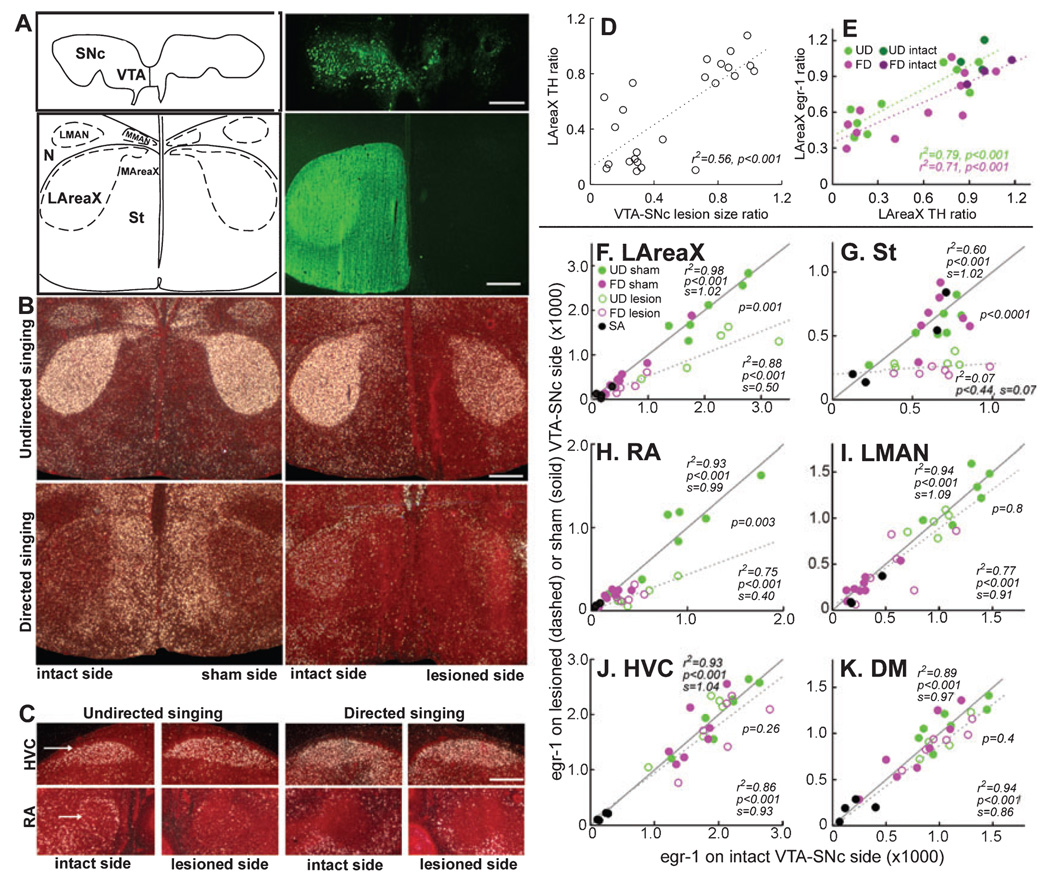
FIG. 2.
VTA–SNc requirements for singing-regulated gene expression in the song system. (A) Top panels, camera lucida drawing (left) and TH somata immunostaining (right, green) showing unilateral lesion of VTA–SNc. Bottom panels, camera lucida drawing and TH fibre immunostaining (green) showing ipsilateral removal of TH input to AreaX and surrounding striatum. Sections are frontal. (B) Egr-1 expression (white silver grains) in LAreaX after UD and FD of sham-operated (left panels) and unilateral VTA–SNc-lesioned (right panels) males, showing decreased expression in LAreaX and striatum on the lesioned side. The sham-operated bird that sang directed song has high expression in the medial striatum, which may be due to locomotor activity (G. Feenders, H. Mouritsen and E. D. Jarvis, personal communication). (C) Egr-1 expression in HVC and RA of VTA–SNc-lesioned animals, showing decreased expression in ipsilateral RA but not HVC. (D) Correlation of VTA–SNc lesion size ratio and TH fibre intensity ratios in ipsilateral : contralateral LAreaX (n = 24 sham and lesion surgery-treated animals; simple regression). (E) Correlation of ratios of TH fibre intensity and egr-1 expression in ipsilateral : contralateral LAreaX (n = 11 FD and n = 9 UD surgery treated animals; and n = 3 FD and n = 3 UD intact animals; simple regression). (F–K) Correlations of egr-1 expression in different brain regions of intact (n = 3 FD, n = 3 UD) and sham-operated (n = 5 FD, n = 4 UD) animals (solid lines and circles) vs. VTA–SNc-lesioned (n = 6 FD, n = 5 UD) animals (dashed lines and open circles). SA animals that received VTA–SNc lesions were included in the correlations as baseline nonsinging control egr-1 levels. In these graphs, expression levels increased in vocal nuclei of both hemispheres with increasing amounts of song production (no. of songs not shown), except for the striatum (St). The r2, P, and slope (s) values (obtained from simple regressions) above the solid lines are for the intact + sham-operated animals; those below the dashed line are for the VTA–SNc-lesioned animals. The P-values between the solid and dashed lines (obtained from multiple regression) show significant differences between the curves of intact + sham-operated and lesioned groups in LAreaX, RA and striatum adjacent to LAreaX, but not in LMAN, HVC or DM. Equal expression between hemispheres results in a slope of 1. Scale bars, 0.25 mm (A, top panel), 0.5 mm (all others).

