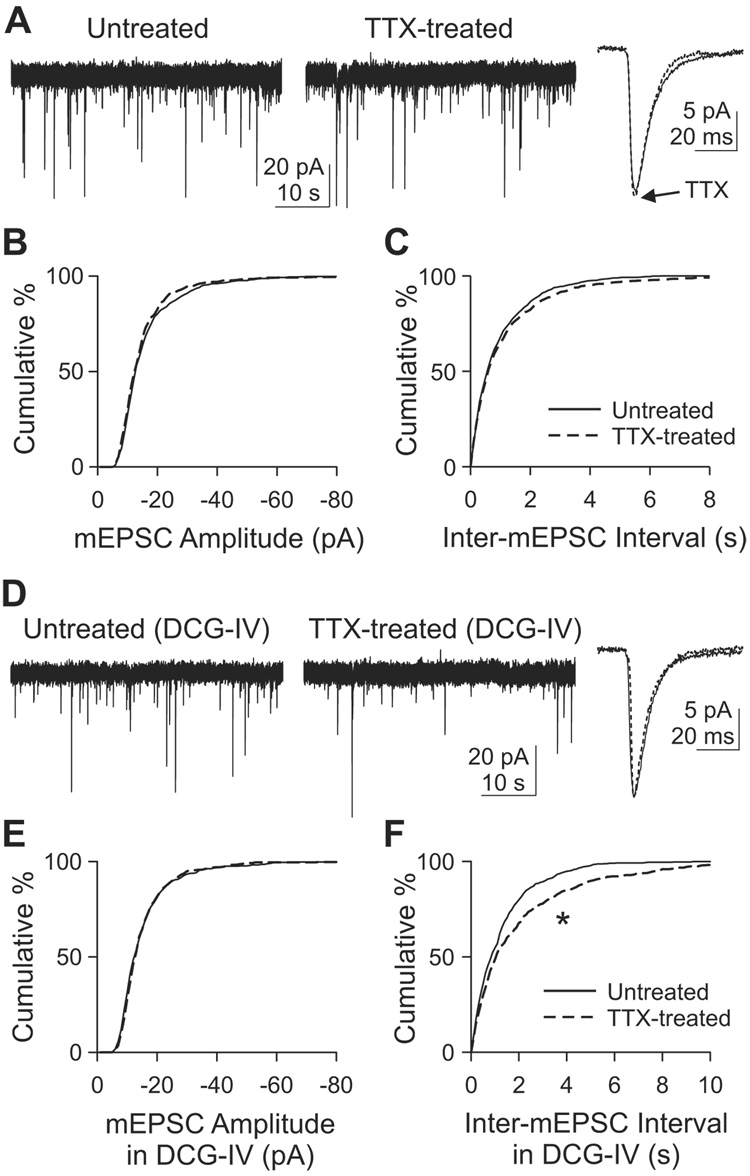
Figure 2. Adaptation of mEPSCs in CA3 following chronic TTX.
(A) Voltage clamp recordings of mEPSCs from CA3 pyramidal cells. Holding potential, −70 mV.
(B–C) Cumulative histogram of mEPSC amplitude (B) or inter-mEPSC interval (C). n=8 each for untreated or TTX-treated group. p>0.1, K–S test for both (B) and (C).
(D) mEPSC recordings at −70 mV in the acute presence of 1 µM DCG-IV in the bath solution. Dotted line, TTX-treated.
(E–F) Cumulative histograms of mEPSC amplitude (E) or inter-mEPSC interval (F) obtained with DCG-IV in the bath. n=6 each for untreated and TTX-treated groups. *, p<10−4, K–S test.

