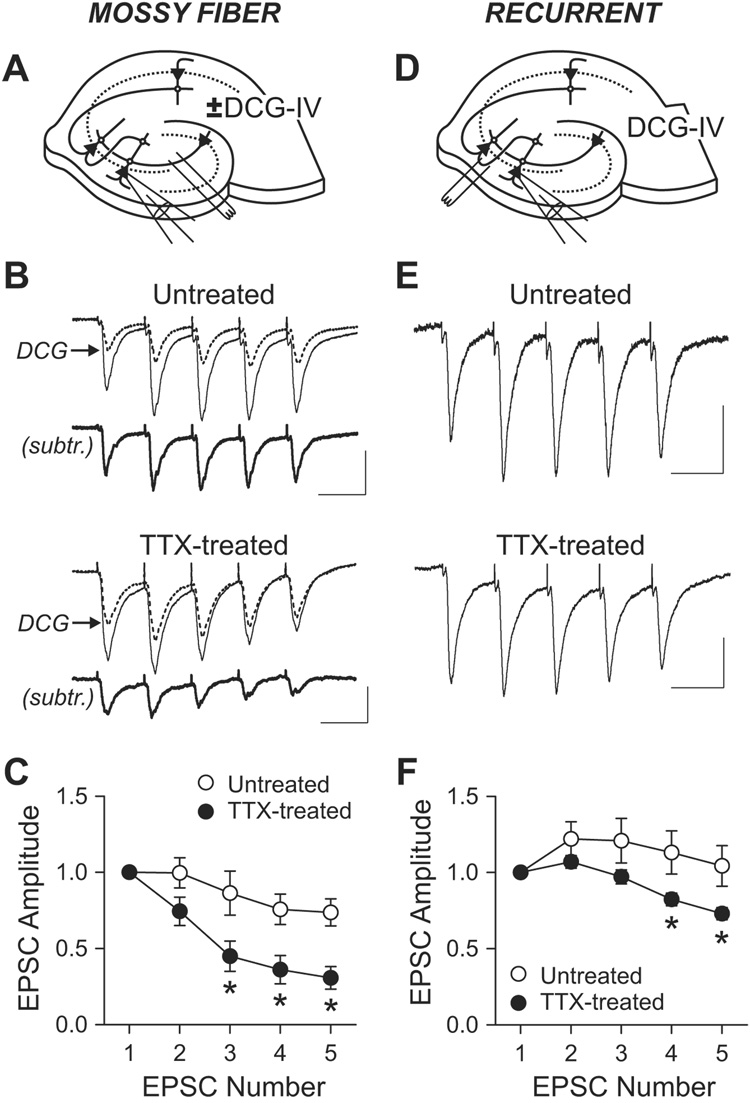
Figure 3. Changes in short-term plasticity of eEPSC by chronic TTX.
(A) Schematic diagram of recording and stimulation for mossy fiber EPSC.
(B) Short-term plasticity of mossy fiber synapses. EPSCs were evoked by stimulating st. lucidum (five times at 20 Hz) in the presence of gabazine (10 µM), D-AP5 (50 µM) and low dose of NBQX (0.3 µM). Mossy fiber EPSCs were measured by subtracting post-DCG-IV (2 µM) current (dotted line) from pre-DCG-IV current (thin solid line). Subtracted traces are shown as thick solid lines (subtr.). Scale bars, 50 pA and 50 ms.
(C) Group data of short-term plasticity at mossy fiber synapse shows larger depression in TTX-treated cells (n=5) than in untreated cells (n=4). *, p<0.01, Bonferroni t-test after two-way ANOVA.
(D) Diagram of recording and stimulation for recurrent synapse EPSC.
(E) EPSCs from recurrent synapses were recorded in 2 µM DCG-IV. Scale bars, 30 pA and 50 ms.
(F) Averaged short-term plasticity at recurrent synapses. Depression over stimulus is larger in TTX-treated cells (n=8) than in control (n=6). *, p<0.05, Bonferroni t-test after two-way ANOVA. For a given condition in a cell, 19–80 traces were averaged.

