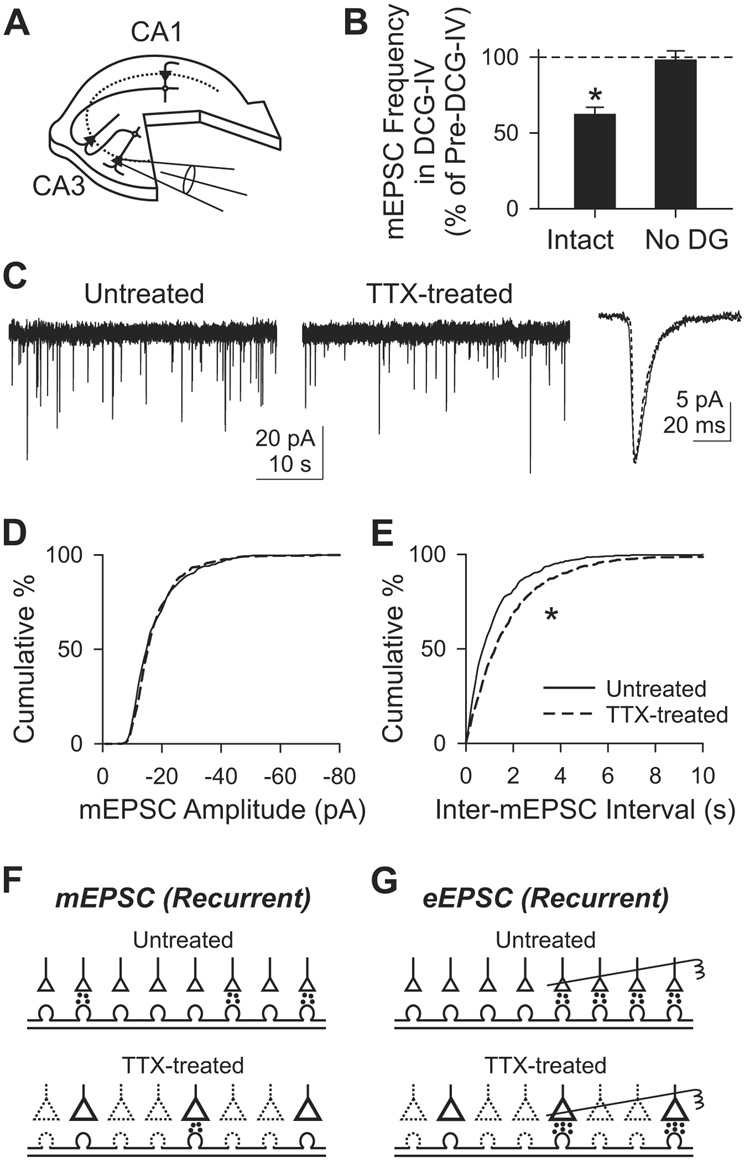
Figure 4. Inactivity-induced adaptation of CA3 mEPSC in slices devoid of dentate gyrus.
(A) Diagram of a dentateless slice. Dentate gyrus was surgically removed at 1 DIV. mEPSCs were recorded from CA3 pyramidal cells.
(B) Suppression of mEPSC frequency by 1 µM DCG-IV in intact (Intact; n=5) and dentateless slices (No DG; n=6). *, p<0.05, paired t-test between pre- and post-DCG-IV.
(C) mEPSC recording at −70 mV from an untreated (solid line) and a TTX-treated cell (dotted line).
(D–E) Cumulative histogram of mEPSC amplitude (D) or inter-mEPSC interval (E). n=6 each for untreated or TTX-treated group. *, p<10−8, K–S test.
(F) Possible mechanism of changes in mEPSC frequency at recurrent synapses. The less frequent minis after chronic TTX might be due to silencing a part of synapses. Dotted lines, inactive synapses.
(G) Adaptation of eEPSC can be explained by an increase in Pr at each synapse, depicted schematically as larger synapses. Stimulating electrodes (right) stimulate four (untreated) or two (TTX-treated) synapses. In Sr2+ (see text), the higher Pr after TTX treatment would tend to increase asynchronous EPSC frequency, but is offset by the reduced density of active synapses, resulting in no detectable change in frequency.

