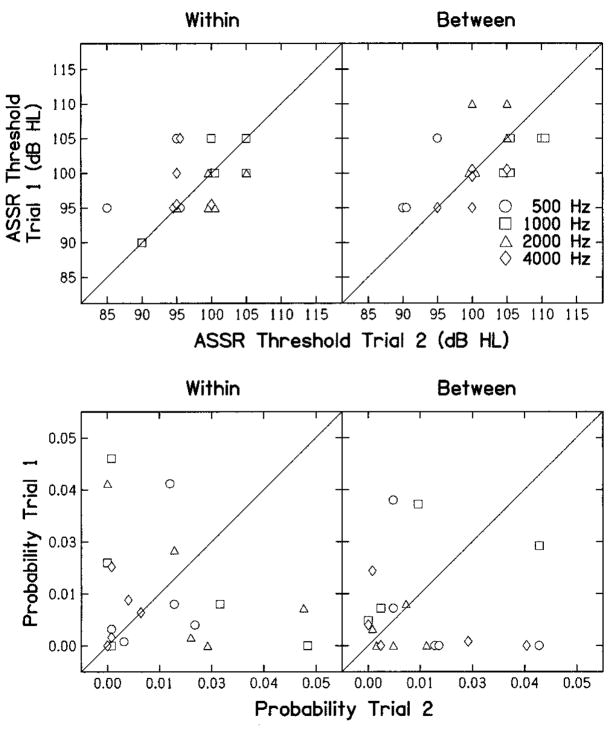
Fig. 1.
Auditory steady-state response (ASSR) thresholds (dB HL) and F-ratio probabilities in top and bottom rows, respectively. In both cases, results from trial 1 are plotted as a function of the results in trial 2. Within-session and between-session repeated measurements are shown in left and right columns, respectively. Data points were offset slightly in the top row to improve the visualization of overlapping points.

