
Fig. 4.
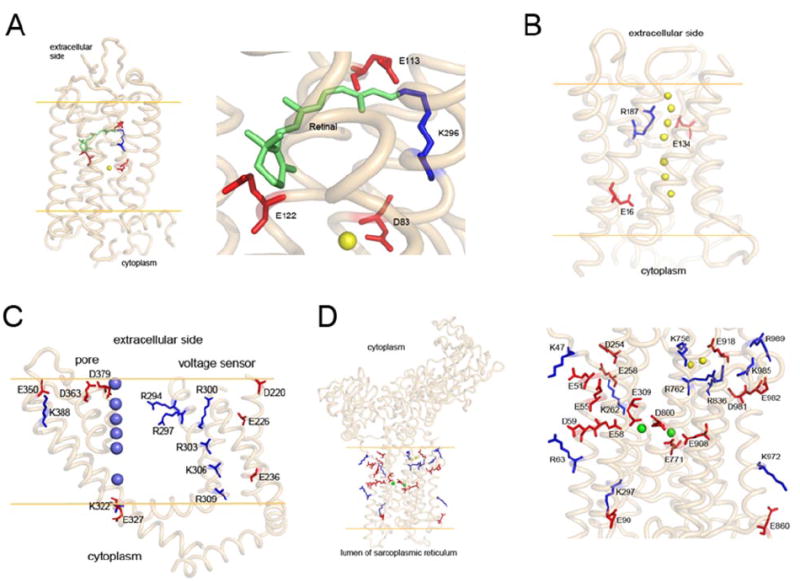
Charge distributions in the transmembrane portions of four mammalian membrane proteins (side view). Orange lines represent the putative membranes. A, charged residues in transmembrane helices of bovine rhodopsin. The right inset shows a close-up of the selected area in the left panel. One positively charged residue (K296, blue stick) in the transmembrane region forms a Schiff base with the bound chromophore, 11-cis-retinal (green). E113 serves as the counterion for K296. Two other negatively charged residues (E122 and D83) are located nearby; D83 forms an H bond with a water molecule (yellow sphere). B, side view of bovine aquaporin 0 (PDB code: 1YMG). Water molecules in the channel are shown as yellow spheres. Side chains of all three charged residues point to the transport channel. C, side view of the voltage sensor and electric pore of the rat Kv1.2K+ channel (PDB code: 2A79). There are seven positively charged residues (blue) and seven negatively charged residues (red) in the transmembrane region. K+ ions are shown as blue spheres. D, side view of rabbit Ca2+-ATPase (PDB code: 1SU4). The inset, on the right-hand side is a close up of the left panel. Five negatively charged residues (E58, E309, E771, D800, and E908) are coordinated with two bound Ca2+ ions (green spheres). The positively charged residues are paired with negatively charged residues: K47 with E51, K262 with E258, K297 with E90, K972 with E860, and R63 with D59. In the top right corner of the right panel is a cluster of five positively charged residues (K758, R762, R836, K985, and R989), three negatively charged residues (E918, D981, and E982), and two water molecules (yellow spheres).