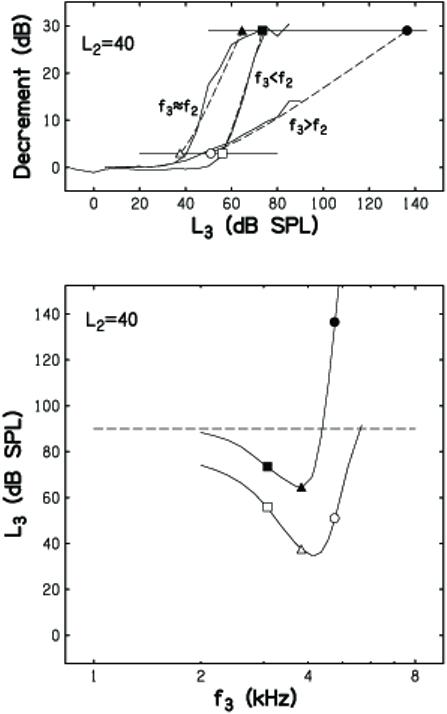
Fig. 1.

Illustration of the approach to data analysis. In both panels, the probe frequency (f2) = 4kHz and the probe level (L2) = 40 dB SPL. Upper panel: Mean decrement-versus-L3 functions for 3 f3’s are shown as solid lines. The upper horizontal line represents the maximum amount of decrement and was determined by calculating the SNR in the control condition (28 dB in this example). This horizontal line, therefore, represents the point at which the response is fully suppressed into the noise floor. The lower horizontal line represents the point at which the response has been suppressed by 3 dB. The dashed lines represent the linear fits to the transformed data (as described in the text). The linear fits were solved for a range of decrements. The 3-dB decrement points are shown in the figure as open symbols for three different suppressor frequencies. The corresponding fully suppressed points are shown as closed symbols. Lower panel: Mean DPOAE STCs plotted as suppressor level (L3) versus suppressor frequency (f3) for two different suppression criteria, 3 dB (lower curve) and complete suppression (upper curve). The symbols plotted on the STCs correspond to the symbols displayed in the upper panel. The points on the upper curve above the horizontal, dashed line represent extrapolated values of L3 (see text for more details).
