
Fig. 2.
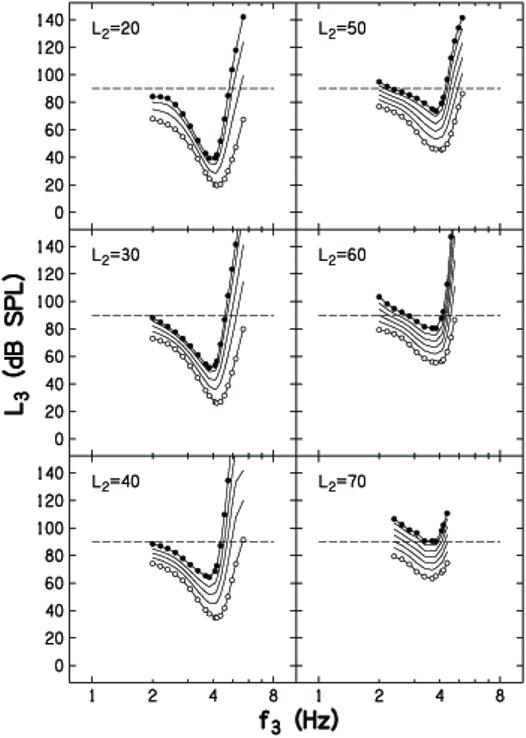
Mean DPOAE STCs. Each panel represents data for a different L2. Within each panel, STCs are shown for suppression criteria ranging from 3 dB (open symbols) to complete suppression (closed symbols) in 6-dB increments. As in Fig.1, points falling above the horizontal, dashed lines do not represent measured suppressor levels, but rather are values extrapolated from the linear fits to the transformed decrement-versus-L3 functions.