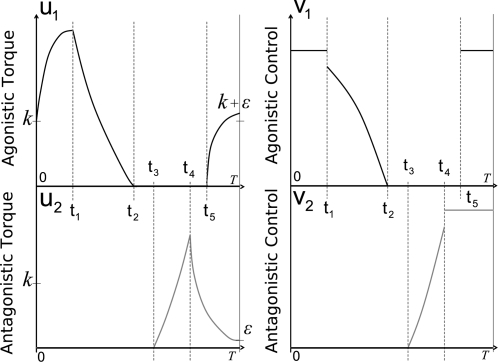
Figure 12. Optimal Triphasic Pattern.
Illustration of the optimal behavior of a 1-dof arm, under the small angles assumption and with a pair of agonistic and antagonistic muscles, modeled by first-order dynamics. The subscripts 1 and 2 denote the flexor and extensor muscles, respectively. The triphasic pattern is an agonistic burst, followed by an antagonistic burst, and again an agonistic burst. The inactivation occurs between the first agonistic and antagonistic bursts. The times ti denote the commutation times. The left graphs illustrates the behavior of the angular torques (u). The right graphs illustrate the behavior of the control signals (ν), that are the input signals for muscles contractions (i.e., the signals driven by motoneurons). All signals are plotted with respect to time t varying between 0 and T.

