
Fig. 12.
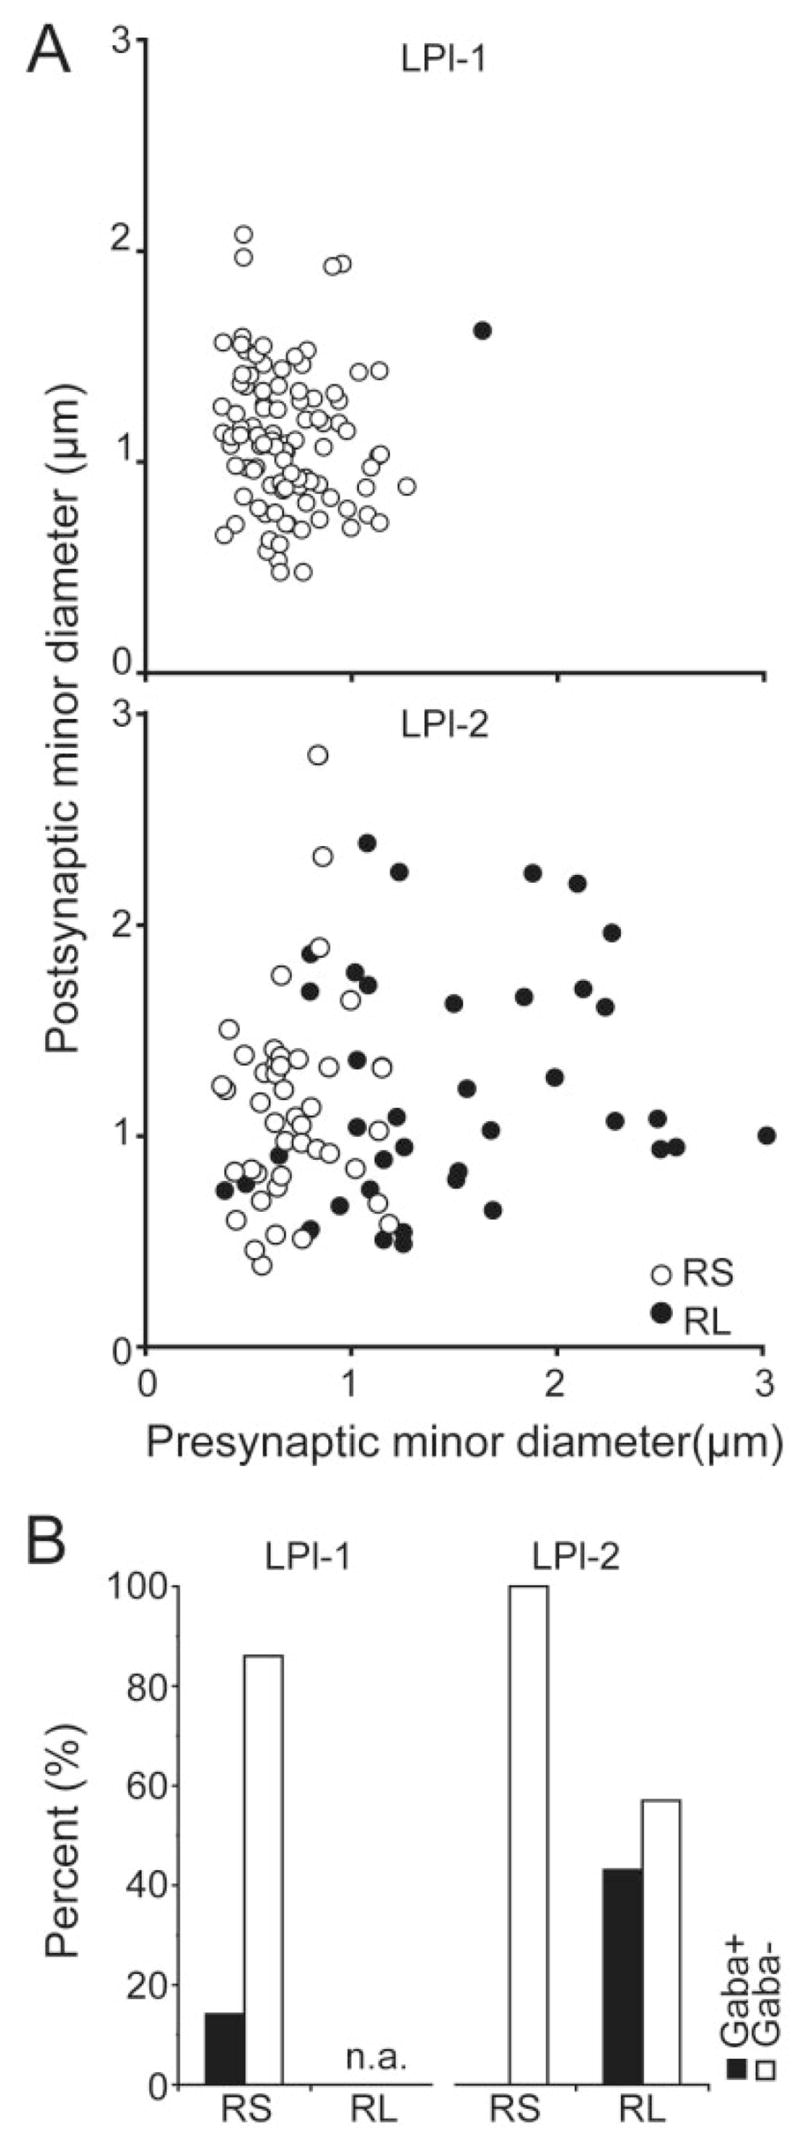
A: Scatterplots of the minor diameter of labelled corticothalamic terminals as a function of the minor diameter of their postsynaptic targets illustrate the relation between the sizes of presynaptic and postsynaptic partners. Upper graph: Synapses in the LPl-1. Lower graph: Synapses in LPl-2. B: Histograms illustrate the number of GABAergic and non-GABAergic postsynaptic profiles in the LPl-1 and LPl-2.