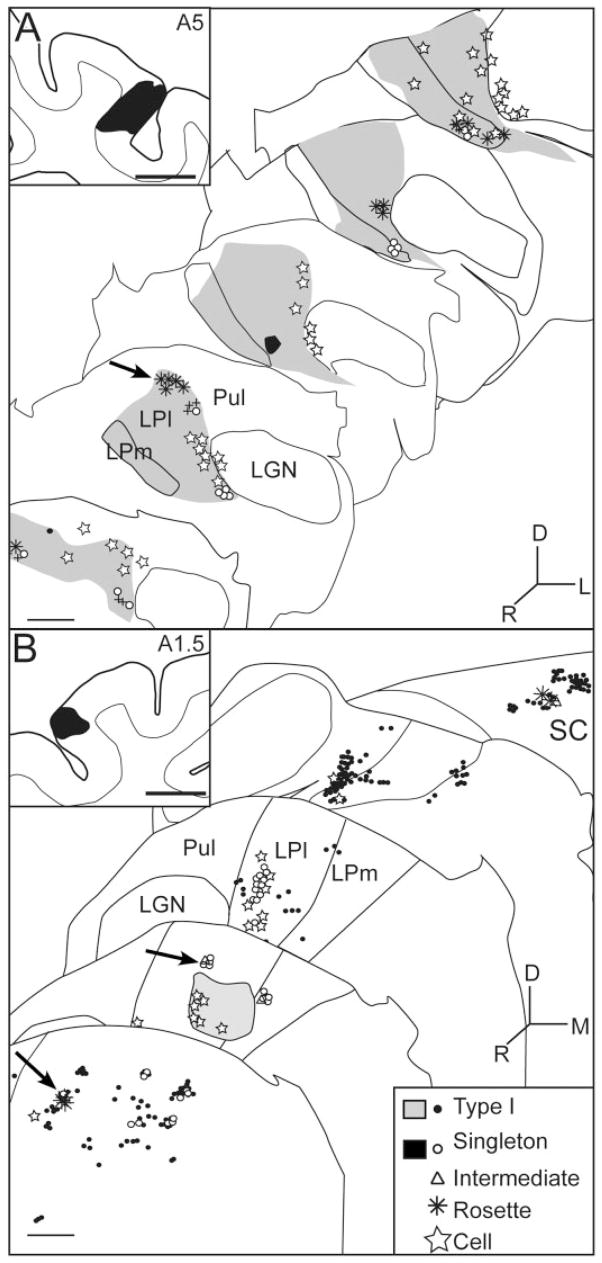
Fig. 3.
Spatial distribution of the various terminal types encountered in LP-pulvinar after a PMLS injection. A,B: Plots of terminals in two different animals with disparate injections in PMLS. The lightly shaded areas depict zones of high density of type I terminals, and the darkly shaded areas contain type I terminals plus singletons. Arrows indicate the LPl-2 subregion of the LP nucleus. Scale bars = 1 mm.

