
Figure 7.
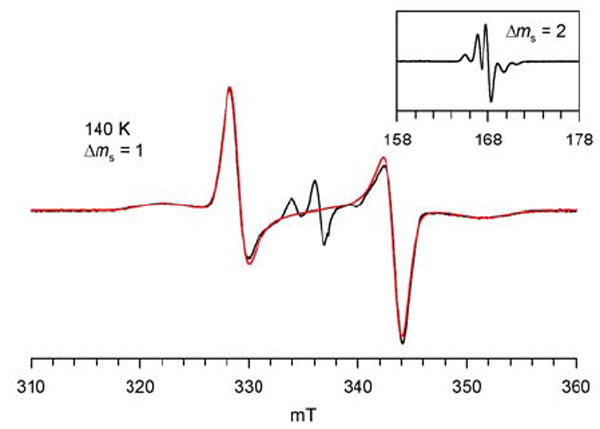
EPR (X-Band, 9.4424 GHz) spectrum of 0.6 mM nitroxide diradical 2 in toluene/chloroform (4 : 1) at 140 K. The spectral simulation of the |Δms| = 1 region is shown as red trace. The fitting parameters for the spectral simulation to the S = 1 state are: |D/hc| = 1.39 × 10⁻² cm−1 (|D/gμB| = 14.9 mT), |E/hc| = 0 cm−1, gx = 2.0064, gy = 2.0064, gz = 2.0030, Gaussian line (Lx = 12 G, Ly = 20 G, Lz = 40 G). The center lines correspond to an S = ½ (monoradical) impurity.