
Figure 1.
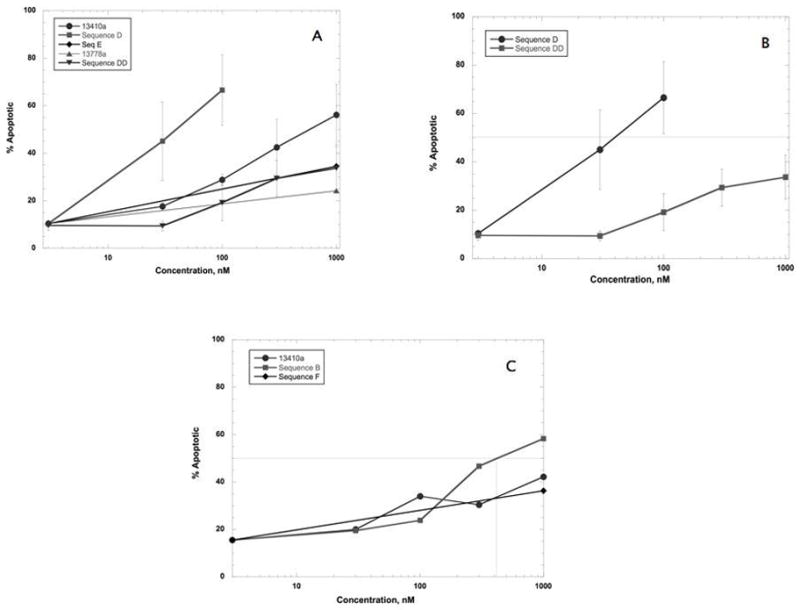
Effect of STAT3-inhibiting oligonucleotides on DU-145 cells. DU145 cells were transfected with oligonucleotides at the concentrations indicated. 48 hrs later, cells were harvested, washed, and stained with FITC-annexin V and PI. Percent apoptosis was quantified by subtracting the % viable population from the total. The concentration of oligonucleotide that induced 50% apoptosis (IC50,) is noted where appropriate. IC50 values were obtained using the Identify tool in the Kaleidagraph software package. The average data from 3 experiments ± SD are shown. A: Comparison of active sequences 13410a and Seq D to control sequences E and 13778a. IC50 values were calculated using the Identify tool from the Kaleidagraph software package. B: Comparison of Sequences D to DD, illustrating the importance of the purines at the 3′ end on STAT3-inhibiting efficacy.