
Figure 3.
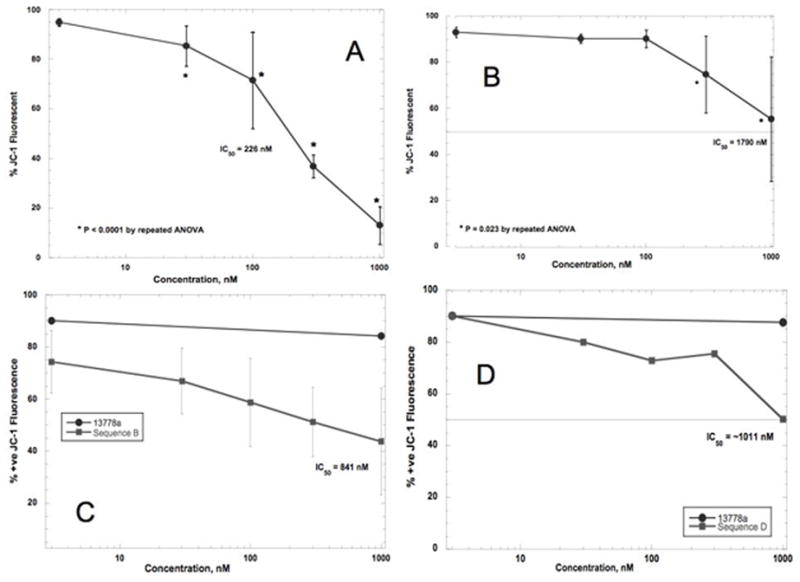
Effect of STAT3-inhibiting oligonucleotides on JC-1 oxidation. A: Effect of Seq D on DU-145 cells. Using JC-1, the IC50 was calculated to be about 226 nM. Differences among treated cells and untreated cells were highly significant (P = 0.0001 by repeated ANOVA). B: Effect of Seq B on DU145 cells. The IC50 was calculated to be about 1790 nM. Differences among treated cells and untreated cells were less significant than for Seq D but still significant (P = 0.023 by repeated ANOVA). C: Effect of Seq B on PANC-1 cells. The IC50 was calculated to be about 841 nM. Differences among values were very significant by repeated ANOVA (P = 0.0058). D: Effect of Seq D on PANC-1 cells. The IC50 was calculated to be about 1011 nM; the differences among values were not significant (P = 0.1225 by repeated ANOVA).