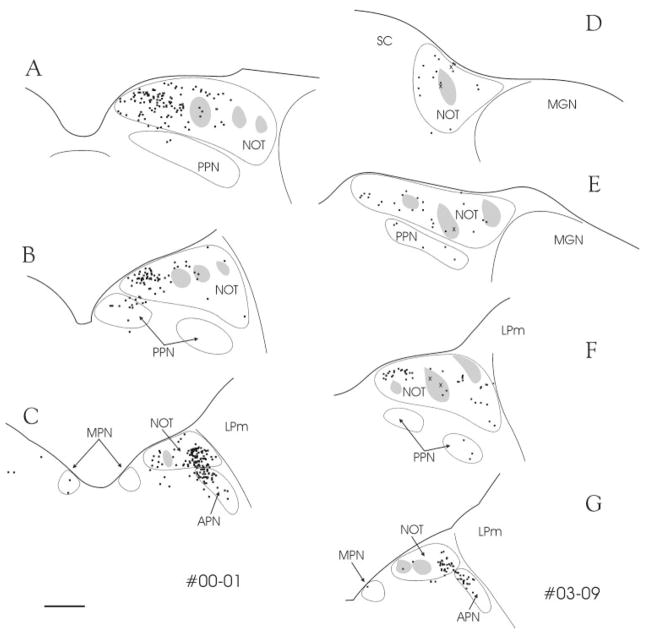
Fig. 5.
A–G: After injections of green fluorescent microspheres (A–C; case 00-01) or wheat germ agglutinin-horseradish peroxidase (D–G; case 03-09) in the PUL, numerous pretectal cells are labeled by retrograde transport (black dots). These cells are primarily located outside of clusters of cells that contain calbindin (gray areas). Nevertheless, a few double-labeled cells can be seen (X). For abbreviations, see list. Section spacing is 600 μm. Scale bar = 1 mm in C (applies to A–G).

