Figure 4.
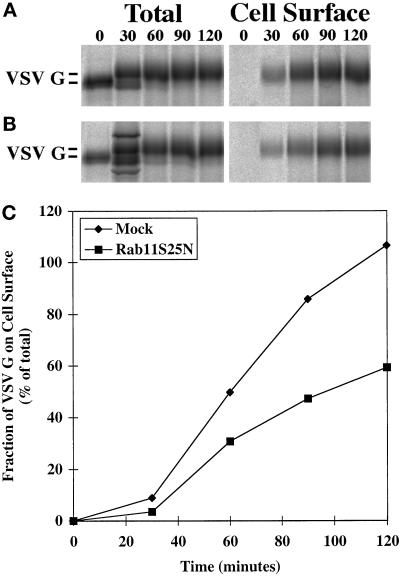
The kinetics of VSV G protein cell surface delivery is markedly altered by overexpression of the dominant negative rab11S25N mutant. Rab11S25N was coexpressed with VSV G protein in BHK cells. At 5 h after transfection, cells were metabolically labeled for 10 min at 37°C and subsequently incubated for various chase times (0–120 min). The kinetics of cell surface delivery was monitored by biotinylation at 4°C. Biotinylated (cell surface) and total cellular VSV G fractions were prepared, analyzed by SDS-PAGE, and quantified with a Fuji Bioimager. Quantitation of VSV G protein cell surface appearance in mock-treated control cells (A) and cells overexpressing rab11S25N mutant (B) is shown in C. (A and B) Left panels, quantitative immunoprecipitation of total VSV G protein from cell lysates after different chase periods using mouse mAb P5D4 (Note that there are two unidentified background bands in the bottom 30-min lane); right panels, cell surface, biotinylated VSV G protein recovered using streptavidin-Sepharose after different chase periods. Representative data from one of three independent trials are shown.

