
Figure 2.
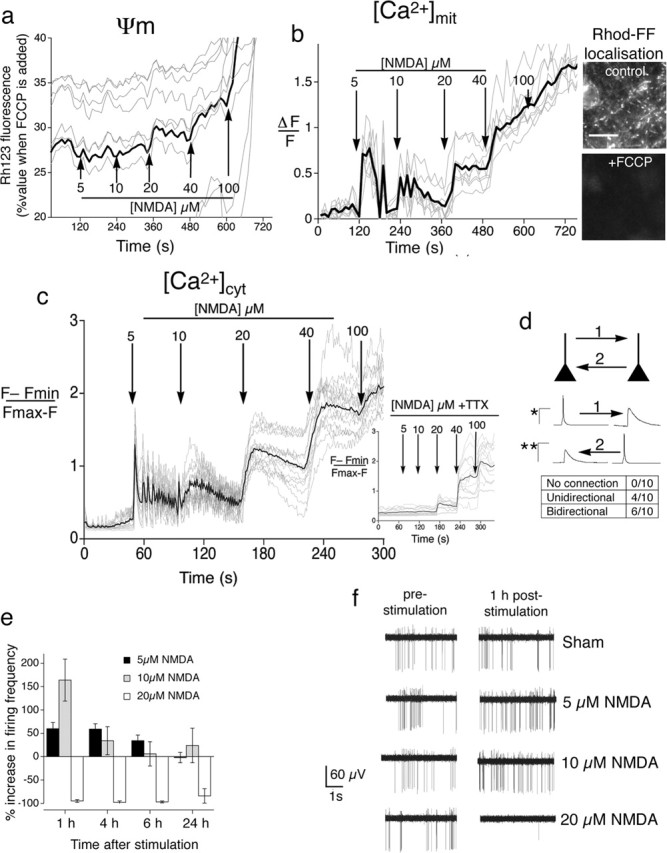
Qualitative differences in the cellular response to protecting versus toxic doses of NMDA. a, Only toxic doses of NMDA perturb the mitochondrial membrane potential. NMDA was added to neurons at regular intervals at increasing concentrations. Loss of mitochondrial membrane potential is indicated by an increase in fluorescence (Keelan et al., 1999) and is expressed as a percentage of the signal obtained when mitochondria are depolarized completely by FCCP treatment at the end of the experiment. Gray lines indicate the traces of individual neurons; the black line indicates the mean. b, Toxic doses of NMDA induce sustained elevated mitochondrial Ca2+, unlike protecting doses. Neurons were subjected to Rhod-FF imaging and exposed to a stepwise increase in NMDA. Gray lines indicate the traces of individual neurons; the black line indicates the mean. Inset, Punctate Rhod-FF localization is abolished by the mitochondrial uncoupler FCCP. Scale bar, 20 μm. c, Protecting doses of NMDA induce AP-dependent intracellular Ca2+ transients. Gray lines indicate the traces of individual neurons; the black line indicates the mean. Neurons were subjected to Fluo-3 imaging in the absence or presence (inset) of TTX. d, Determining the degree of synaptic connectivity between pairs of nearby neurons (≤ 250 μm apart). Example is shown of the AP and resulting EPSP in a pair of neurons synaptically connected in both directions (“1” and “2”). ∗Calibration applies to induced AP (50 mV/50 ms); ∗∗calibration applies to EPSP triggered in postsynaptic neuron (5 mV/50 ms). e, Protecting doses of NMDA strongly enhance neuronal network activity. Shown is an MEA recording of neurons exposed to the indicated levels of NMDA and monitored over time. Mean ± SEM is shown of eight individual arrays for each condition. f, Examples of MEA recording traces.