
Fig. 3.
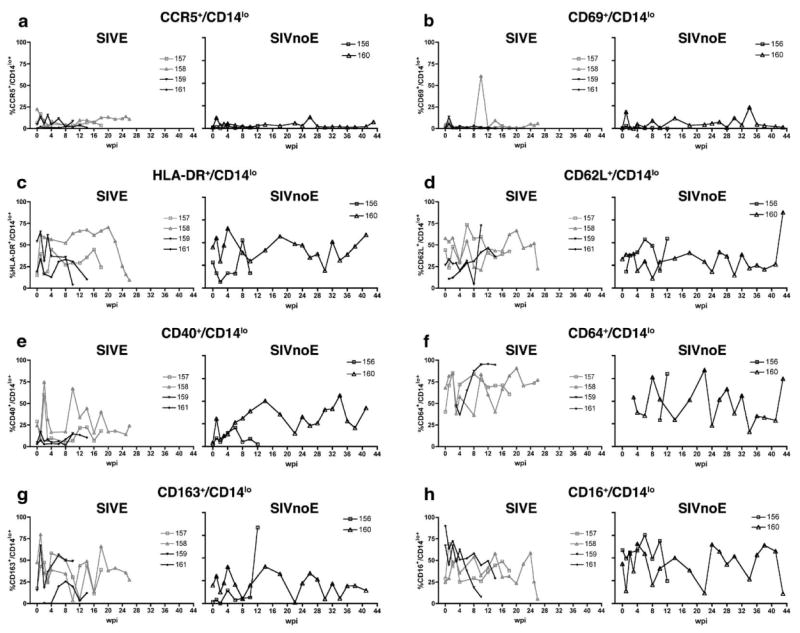
Proportion of CD14lo cells that expressed phenotypic markers of activation during the course of infection in 6 pigtailed macaques infected with SIV/DeltaB670. Based on histological findings, macaques were retrospectively classified at post-mortem for the presence of SIV encephalitis. For each phenotypic marker, macaques that developed SIVE (M157, M158, M159, and M161) are shown in the left graph, while macaques that did not develop SIVE (SIVnoE) (M156 and M160) are shown in the right graph. At indicated weeks post-infection (wpi), whole blood was stained with anti-CD14 and the panel of antibodies listed in Table 1. CD14lo cells were gated as shown in Fig. 1. Shown here are longitudinal changes in percent expression of each phenotypic marker: (a) CCR5+/CD14lo, (b) CD69+/CD14lo, (c) HLA-DR+/CD14lo, (d) CD62L+/CD14lo, (e) CD40+/CD14lo, (f) CD64+/CD14lo, (g) CD163+/CD14lo, and (h) CD16+/CD14lo.