
FIGURE 1.
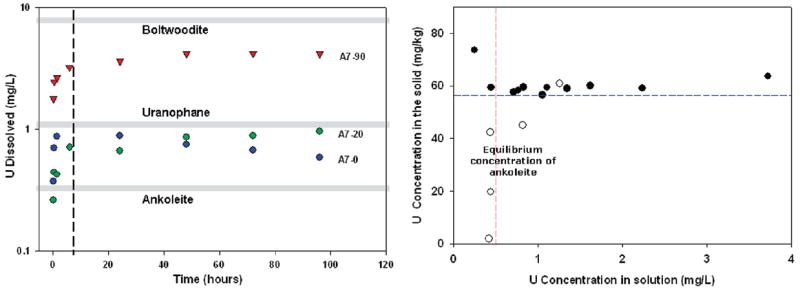
(Left panel) Results of uranium batch dissolution experiments. Dashed line represents apparent change in the rate of dissolution between 0–6 and 6–96 h. Gray lines represent equilibrium uranium concentrations of uranyl phases in synthetic porewater. (Right panel) Uranium dissolution after 24 h from fixed sediment masses of A7-90 (Black circles = 0.5 g; hollow circles = 0.1 g) in different volumes (2–40 ml) of synthetic pore water. Dashed red line represents the approximate solubility limit of one mineral phase (predicted as ankoleite using Visual Minteq), while the dashed blue line represents the approximate solid phase concentration of a second mineral phase(s).