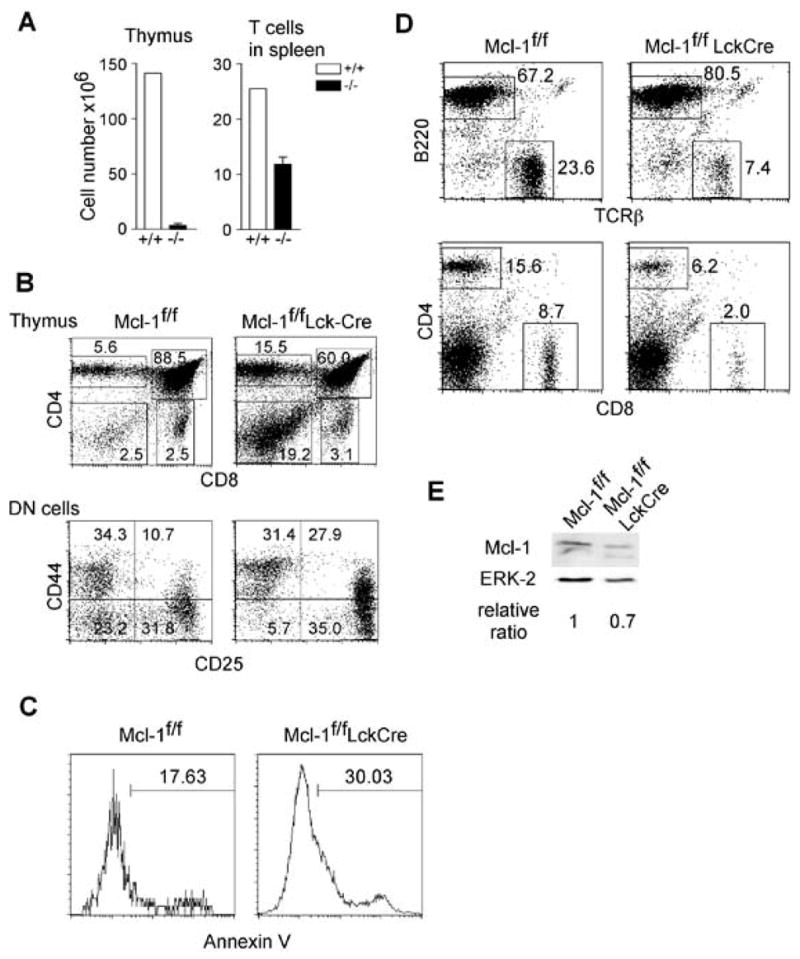
Figure 2. Blockade of DN thymocyte development in Mcl-1f/fLck-Cre mice.

A. Total numbers of thymocytes and splenic T cells in Mcl-1f/fLck-Cre and control mice (n=3). Data are presented as mean+SD. B. FACS profiles of the thymus of Mcl-1f/fLck-Cre mice. The upper panels show total thymocytes and the lower panels show pre-gated CD3−CD4−CD8− DN cells. C. Apoptosis in the DN compartment of Mcl-1f/fLck-Cre mice as measured by Annexin V staining ex vivo. D. FACS profiles of the spleens of Mcl-1f/fLck-Cre and control mice. E. Mcl-1 protein expression in purified T cells from Mcl-1f/fLck-Cre and control mice as determined by Western blot. ERK-2 serves as a loading control.
