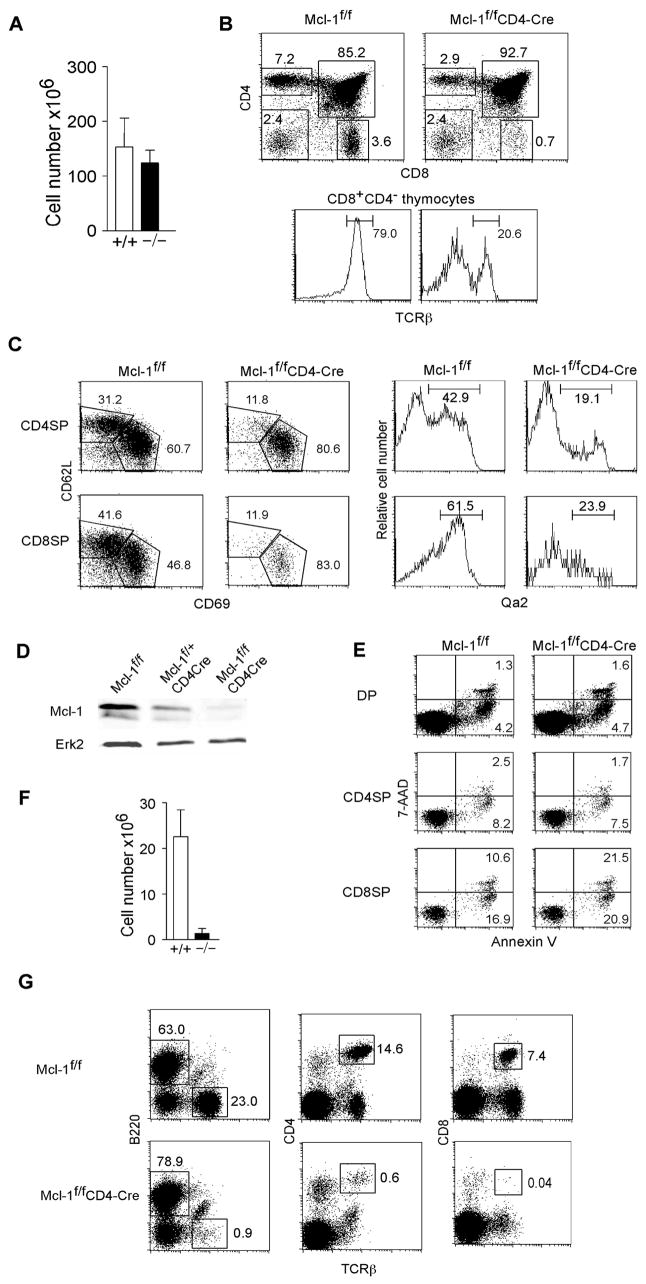
Figure 3. Impaired SP compartment in Mcl-1f/fCD4-Cre mice.
A. Number of total thymocytes in Mcl-1f/fCD4-Cre and control mice (n=5). Shown are mean+SD. B. FACS profiles of thymocytes from Mcl-1f/fCD4-Cre and control mice on a mixed 129 x C57BL/6 background. The bottom plots represent TCRβ expression in CD8+ SP thymocytes. C. FACS profiles of CD4+ and CD8+ SP thymocytes stained with maturation markers CD62L, CD69, and Qa2. Cells were gated on CD4+ or CD8+ SP thymocytes. D. Expression of Mcl-1 protein in total thymocytes from Mcl-1f/fCD4-Cre and control mice as detected by Western blot. Erk2 serves as a loading control. E. Apoptotic rates of DP, CD4+ SP, and CD8+ SP thymocytes from Mcl-1f/fCD4-Cre and control mice as assessed by Annexin V and 7-AAD staining. F. Number of total T cells in the spleen of Mcl-1f/fCD4-Cre and control mice. T cells were enumerated by FACS staining with anti-CD3 and cell counting (n=5). G. FACS profiles of the spleens of Mcl-1f/f CD4-Cre and control mice as assessed by CD4, CD8, B220, and TCRβ staining. The data are representative of 3–5 individual experiments.

