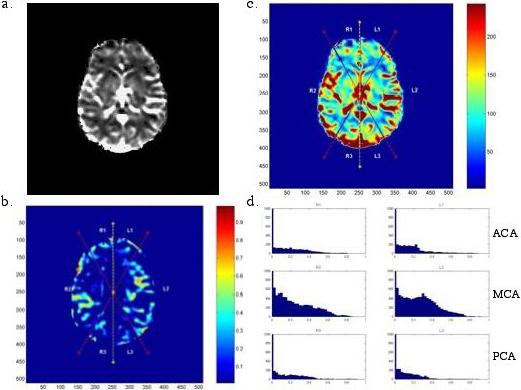
Figure 1.

Analysis of MR brain scan of a patient demonstrating post-CEA neurocognitive dysfunction. The original MR perfusion gray-scale image (A) is converted to a color scale and divided into six vascular territories (B). A relative difference map is generated (C). High intensity in the RDM represents regions of relative CBF asymmetry. In this case, CBF asymmetry is pronounced in the MCA territories. Histograms depicting the distribution of RDM intensities are generated (D): the CBF asymmetry being represented by the broad distribution of the MCA histogram
