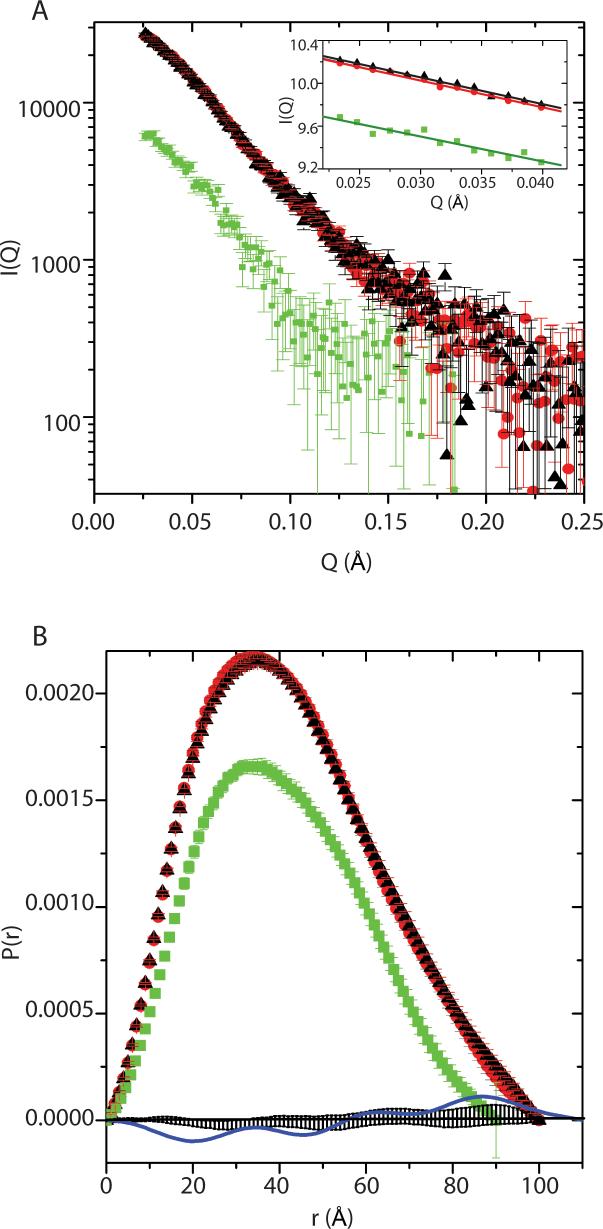
Figure 3. Solution X-ray scattering by LLhP.
(A) I(Q) versus Q for apo-LLhP (green), LLhP-lacO1 (red) and LLhP-lacO1-HX (black). The inset shows a Guinier plot of the low-Q data and the linear fits obtained (apo is green; LLhP-lacO1 is red; LLhP-lacO1-HX is black). The scattering data are shown normalized to constant monitor counts, and for the Guinier plots, the apo-LLhP data are multiplied by 3 to allow for easier display. (B) P(r) versus r (large symbols) calculated using the data in (A), using the same key. Difference plots are also shown in small symbols near the origin Y=0 for the P(r) profiles of LLhP-lacO1 with and without hypoxathine (black). For comparison, a difference plot is also shown for the LacI R3 dimer bound to lacO1 with and without IPTG (from (23); blue).

