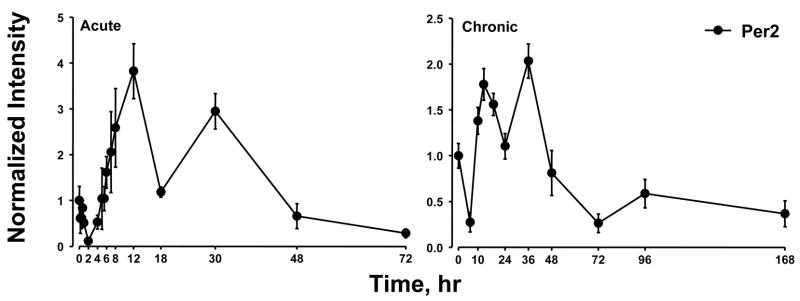
Figure 5.
Expression patterns of PER2 as a function of time after MPL administration to adrenalectomized animals. Left panels present data from acute (bolus 50 mg/kg) MPL dosing; right panels present data from chronic (0.3 mg/kg/h) MPL infusion. Array signals are normalized to zero time control values, and plotted as mean relative intensity at each time point. Error bars represent 1 sd of the mean.

