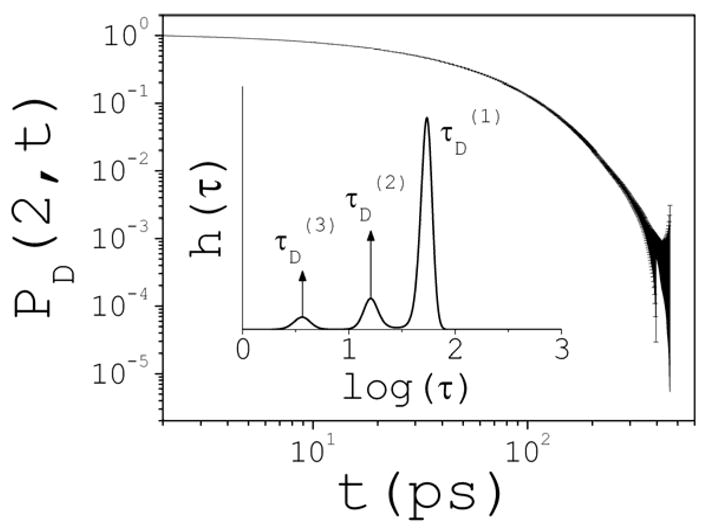
Fig. 10.

Typical form of the cluster survival-time probability distributions PD(n,t) and error estimates σ (t) shown; the example is for ion pairs at 2 M. Inset: solution of the corresponding decay-rate spectrum h(τ) obtained with the maximum entropy method. A continuum of rates τ describes the kinetics; three main discrete decay times can be identified in this case, τD(i) (i=1,2,3), corresponding to the peaks of h(τ); the contribution of each rate can be approximated by the area under the corresponding peak.
