
Figure 1.
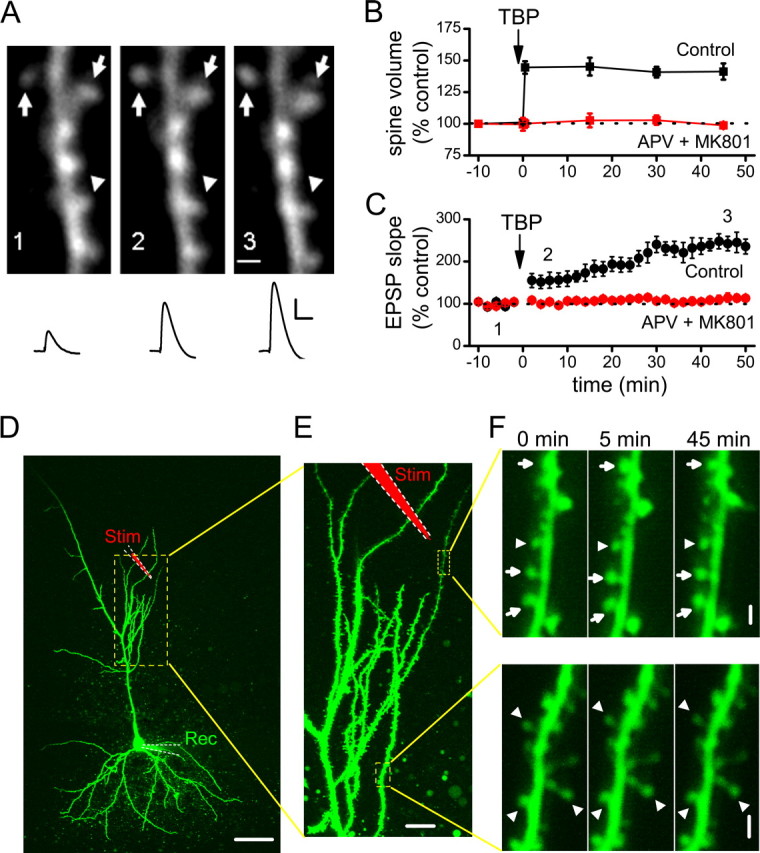
Induction of spine expansion and LTP with TBP. A, A representative experiment in which both spine size and synaptic responses (EPSPs) were monitored. TBP induces rapid expansion of spine heads in a portion of spines imaged (arrows), while leaving the rest of the spines unaffected (arrowheads). Representative EPSPs recorded at the same time points are shown under the images. Calibration: 5 mV, 50 ms. Scale bar, 1 μm. B, Population data showing the induction of spine expression associated with TBP-LTP. Spine head expansion occurred within 30 s of TBP, which was given at time “0.” This increase in spine volume was long-lasting, persisting for at least 45 min after TBP (black symbols), and was blocked by bath perfusion of NMDAR antagonists (APV and MK-801; red symbols). Error bars indicate SEM. C, The expression of LTP after TBP showed a biphasic time course, with a small (∼50%) but immediate increase in the EPSPs after TBP followed by a larger but gradual increase in the potentiation that reached a plateau ∼30 min after TBP (black symbols). LTP was also completely blocked by NMDAR antagonists (red symbols). D, An image showing a representative neuron recorded and imaged, together with the stimulating and recording electrodes. The local stimulating electrode is marked as red (Stim), whereas the recording electrode is marked green (Rec). The region inside the yellow dashed lines are shown at a higher magnification in E. Scale bar, 50 μm. E, Two regions being repetitively imaged sequentially are marked by the yellow dashed lines. Scale bar, 10 μm. F, Changes in spine size in the two imaged regions before and after TBP. A portion of spines in the region close to the stimulating electrode (top panel) showed persistent change after TBP (expanded spines are marked by arrows, whereas nonchanging ones are marked by arrowheads; the timing of image acquisition are indicated by the numbers above them. TBP was given at 0 min). Spines in the region far away (bottom panel) did not show persistent changes. These two regions were imaged subsequently within 1 min. Scale bar, 1 μm.