
Figure 3.
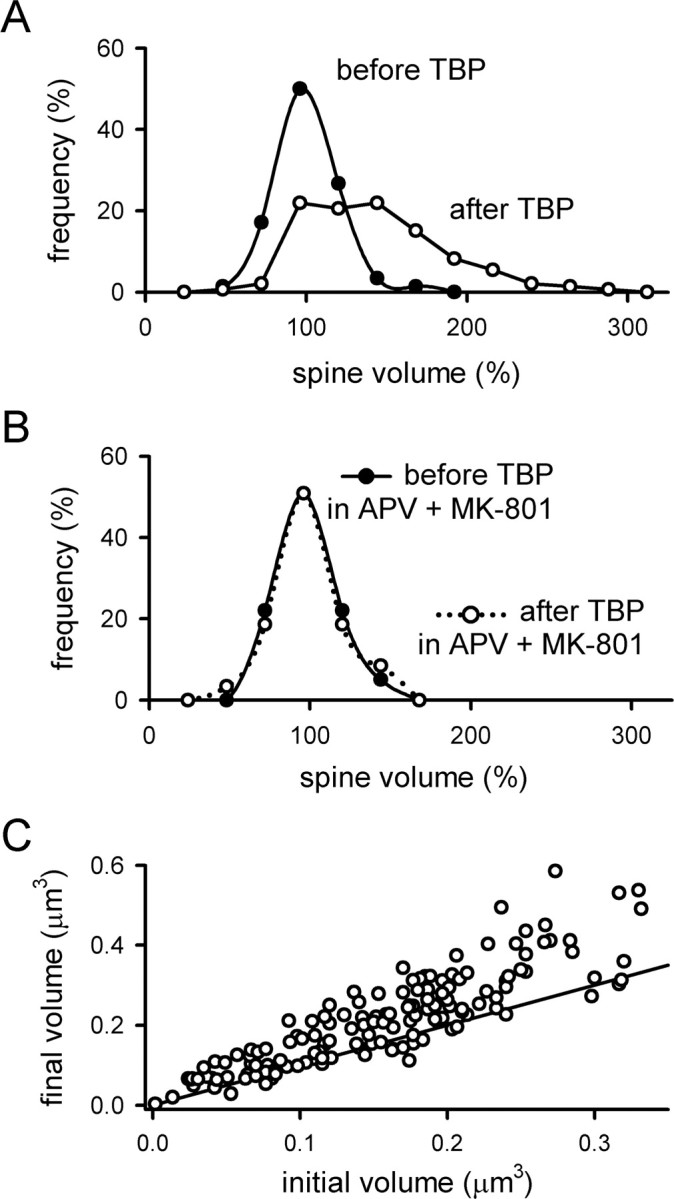
Analysis of changes in spine volume associated with TBP. A, The distribution of spine volumes was measured immediately before TBP (filled circles) and 45 min after TBP (open circles). In both cases, the volume of each spine was normalized to the values seen 10 min before TBP. Before TBP, the distribution is centered around 100%, indicating that there is no systematic drift in the measured mean spine volume between measurements. After TBP, a large number of spines have increased in volume, causing a spread in the distribution toward larger values. B, The distribution of normalized spine volumes was examined as in A, but when TBP was given in the presence of NMDAR antagonists (APV and MK-801). Neither the mean volume nor the distribution of volumes was affected by TBP in the absence of NMDAR activity. C, The increase in spine volume is not restricted to small spines. The absolute spine volumes immediately before and 45 min after TBP were plotted against each other for each spine. The line has a slope of 1, indicating no change in spine volume; points that fall above the line indicate an increase in volume. Spines showed an increase in volume over the entire range of initial sizes.