
Figure 2. Expression of homeobox genes in the developing dentition.
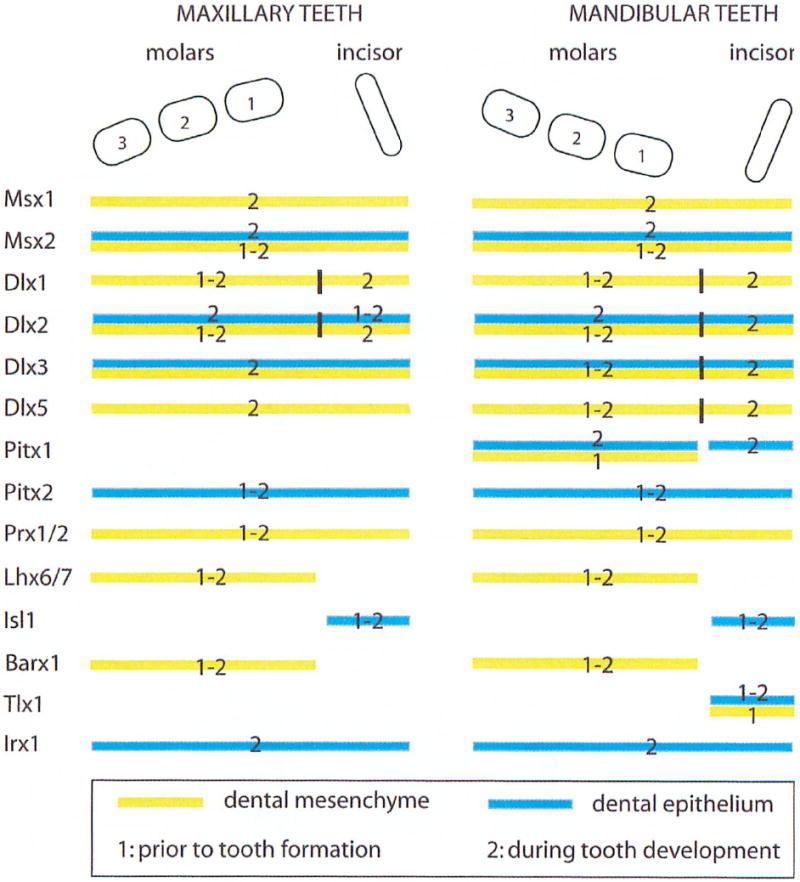
Diagram representing the distribution of homeobox genes during odontogenesis. Areas of expression are defined using three parameters: maxillary versus mandibular teeth, molars versus incisors, and epithelium versus mesenchyme. Since several markers are expressed in stomodeal tissues prior to tooth formation but have a different distribution after the initiation of tooth development, a temporal dimension was added to the diagram: distribution prior to tooth formation (1) and distribution during tooth development (2).