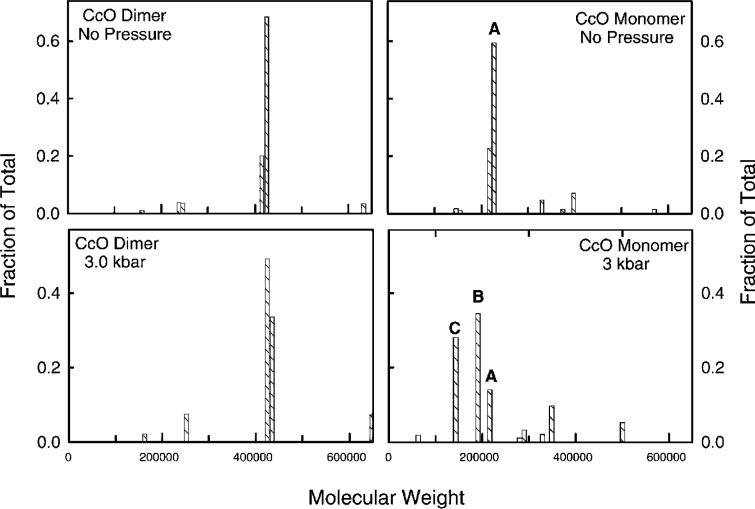
Figure 2.
Protein molecular weight distributions for dimeric and monomeric CcO before and after exposure to 3 kbar of hydrostatic pressure. In the left panels are protein molecular weight distributions for dimeric CcO before (top) and after (bottom) pressurization at 3 kbar for 2 h. In the right panels are protein molecular mass distributions for 13-subunit monomeric CcO before (top) and after (bottom) pressurization at 3 kbar for 2 h. The histogram bars labeled A, B, and C are CcO subcomplexes for which Mw ≅ 205 000, 190 000, 150 000, respectively. Sedimentation velocity data for CcO were acquired at 420 nm during sedimentation at 40 000 rpm. Duplicate samples were analyzed and gave nearly identical results. Data were analyzed by the C(s) procedure (21), which generates a distribution of s20,w and D20,w for each sample based upon a single value for f/fo. The two coefficients are used to evaluate a distribution of protein molecular weights assuming a constant amount of bound detergent (δdet). The analysis procedure for each CcO sample involved use of the following values for these constants: δdet = 0.30 and f/fo = 1.33 for dimeric CcO before pressurization and δdet = 0.30 and f/fo = 1.35 for dimeric CcO after pressurization; δdet = 0.40 and f/fo = 1.31 for 13-subunit CcO before pressurization and δdet = 0.40 and f/fo = 1.20 for 13-subunit CcO after pressurization. The smaller f/fo value for monomeric CcO after pressurization most likely was due to the influence of the smaller subcomplexes of CcO. Pressurization conditions were identical to those described in the legend of Figure 1.

