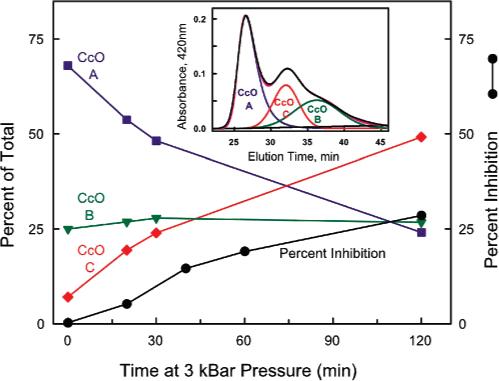
Figure 6.

Correlation between pressure-induced inactivation of CcO and the generation of a 9-subunit subcomplex of CcO. The relative amounts corresponding to CcO-A (13 subunits), CcO-B (11 subunits), and CcO-C (9 subunits) are plotted in the main figure as a function of pressurization time at 3 kbar. The generation of CcO peak C, i.e., CcO-C containing only 9 subunits (red line), correlates well with the percent loss of enzymatic activity (black line). These data were generated by measuring the electron transfer activity of CcO and the percent of the three forms of CcO, i.e., CcO-A (13 subunits), CcO-B (11 subunits), and CcO-C (9 subunits), as a function of exposure time at 3 kbar of hydrostatic pressure. To obtain the percent CcO-A, CcO-B, and CcO-C, the data depicted in Figure 3 (right panel) were quantified by fitting each elution profile to three slightly skewed gaussians. The inset illustrates such an analysis for the elution of CcO after it was exposed to 3 kbar of hydrostatic pressure for 30 min. The three gaussians fit the original elution profile (black line) very well. The relative amounts corresponding to CcO-A (13 subunits), CcO-B (11 subunits), and CcO-C (9 subunits) were calculated from their respective areas under each gaussian.
