
Figure 2.
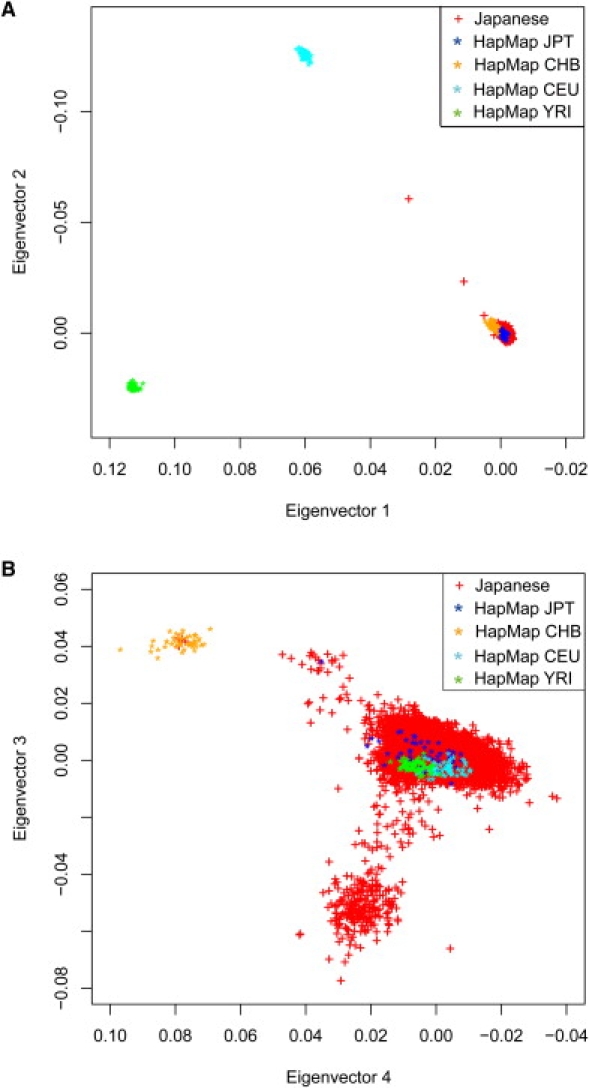
Relatedness between Japanese, Han-Chinese, European, and African Individuals
The relatedness between the 7003 Japanese individuals, along with 60 European (CEU), 60 African (YRI), and 90 East-Asian (45 JPT and 45 CHB) individuals from the HapMap project,24 was analyzed. The genotype data of 135,754 SNPs were analyzed by use of the smartpca program in EIGENSOFT.15
(A) The individuals were plotted in a two-dimensional graph, with the first (x axis) and the second (y axis) components of the Eigenvector factors.
(B) The individuals were plotted in a two-dimensional graph, with the third (x axis) and the fourth (y axis) components of the Eigenvector factors.