
Figure 4.
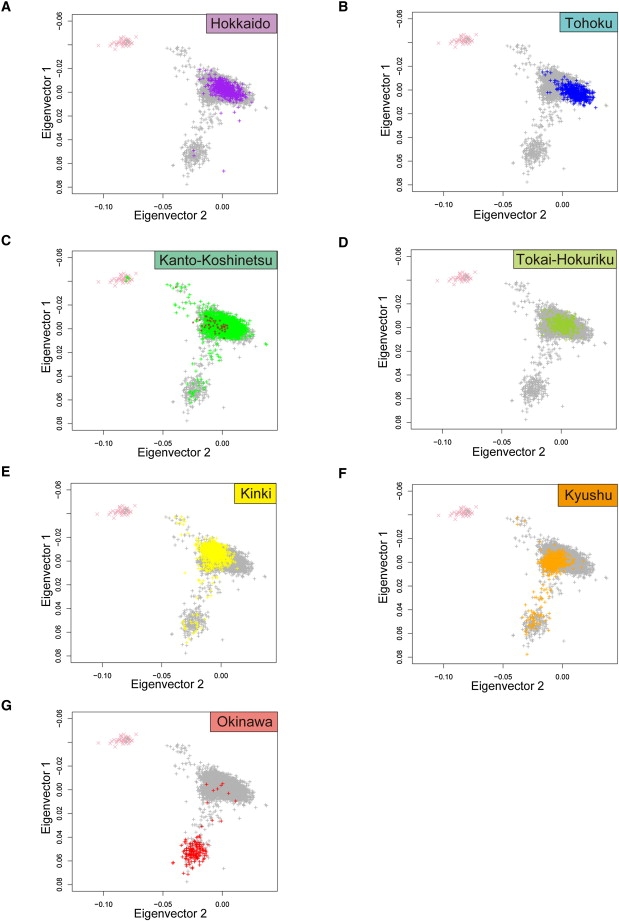
PCA Plots of the Japanese Individuals for Each Geographical Region
The PCA plots in Figure 3A are shown with respect to the seven regions. In each plot, the Japanese individuals (denoted by “+”) from one of the seven regions are highlighted by the colors in Figure 1, whereas the individuals from the other six regions are colored in gray. The HapMap CHB individuals and the HapMap JPT individuals (C) are shown by pink crosses and brown stars, respectively. The average values of Eigenvector 1 (PC1) and Eigenvector 2 (PC2), with standard deviations for the individuals from each region, are in given below.
(A) Hokkaido (purple; PC1 = −0.00140 ± 0.00672; PC2 = 0.00286 ± 0.00723).
(B) Tohoku (blue; PC1 = 0.00291 ± 0.00449; PC2 = 0.01118 ± 0.00716).
(C) Kanto-Koshinetsu (green; PC1 = −0.00100 ± 0.00634; PC2 = 0.00297 ± 0.00819).
(D) Tokai-Hokuriku (yellow-green; PC1 = −0.00188 ± 0.00419; PC2 = 0.00117 ± 0.006255).
(E) Kinki (yellow; PC1 = −0.00479 ± 0.01176; PC2 = −0.00690 ± 0.00707).
(F) Kyushu (orange; PC1 = 0.00451 ± 0.01514; PC2 = −0.00823 ± 0.00758).
(G) Okinawa (red; PC1 = 0.05017 ± 0.01335; PC2 = −0.02244 ± 0.00756).