
Figure 2.
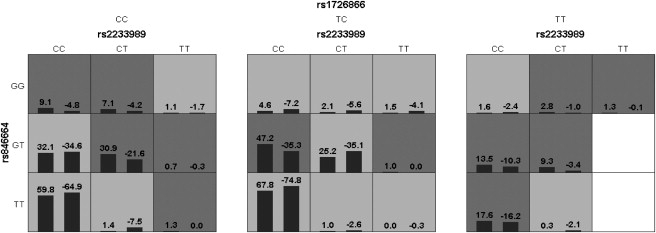
The Identified Best Model that Comprises rs2233989 and rs846664 in TAS2R16 and rs1726866 in TAS2R38
In each combinatorial cell, the left bar represents a positive score and the right bar is a negative score. High-risk cells are indicated by dark shading, low-risk cells by light shading, and empty cells by no shading.