
Figure 2.
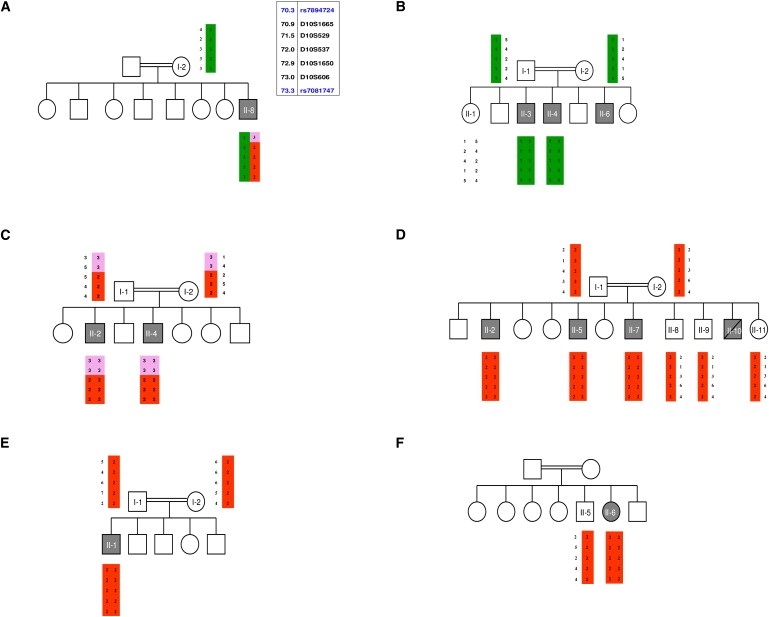
Haplotype Analysis Performed in Six Families with H Syndrome
Affected individuals are marked by gray symbols. The disease-associated haplotypes in the linked interval on chromosome 10q21.3–q22.1 are shown by vertical bars (red and green) in families A–F. Alleles excluded by recombination events are marked in pink. The physical locations of the polymorphic microsatellites are given near the haplotype for individual AI-2.