
Figure 2.
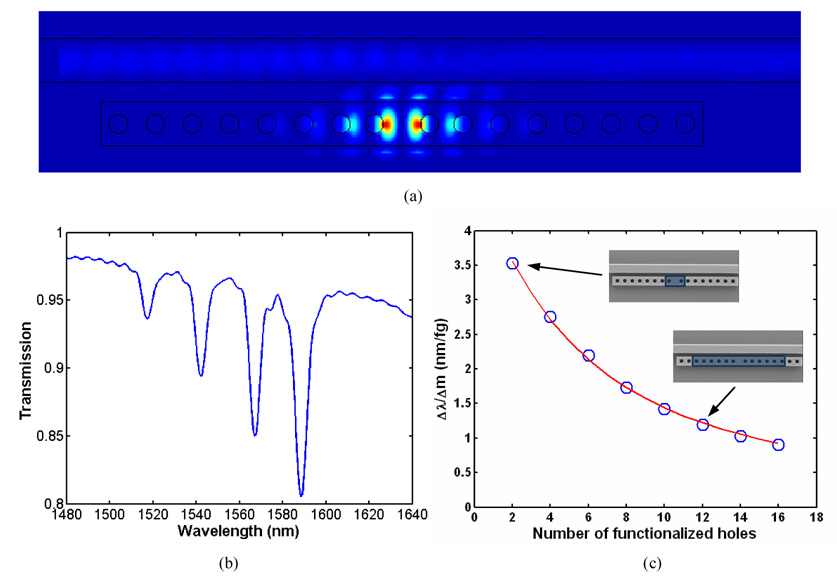
(a) Steady state electric field distribution for the resonant wavelength (b) FDTD simulation showing the output spectrum for a device consisting of a waveguide with four evanescently coupled side cavities adjacent to it. Here each resonator consists of a cavity with four holes on either side. (c) FDTD simulation showing the mass sensitivity of the device plotted as a function of the number of functionalized holes. The blue circles indicate the sensitivity values calculated from the simulations. The red curve shows a least-squares fit using an analytical model for the device sensitivity which is described below.