
Figure 6.
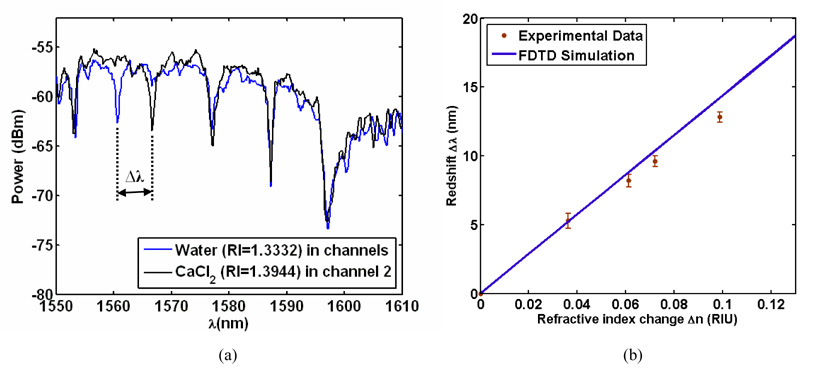
(a) Output spectrum for a NOSA where one of the 5 resonators is fluidically targeted, first with water and then with a CaCl2 solution. The resonance of the targeted resonator shifts towards the red end of the spectrum due to the higher refractive index of the CaCl2 solution. (b) Experimental data (with error bars indicating inter-device variability) showing the redshifts for various refractive index solutions. The blue line is the theoretically predicted redshift from FDTD simulations. The experimental data is in excellent agreement with the theory.