Figure 1.
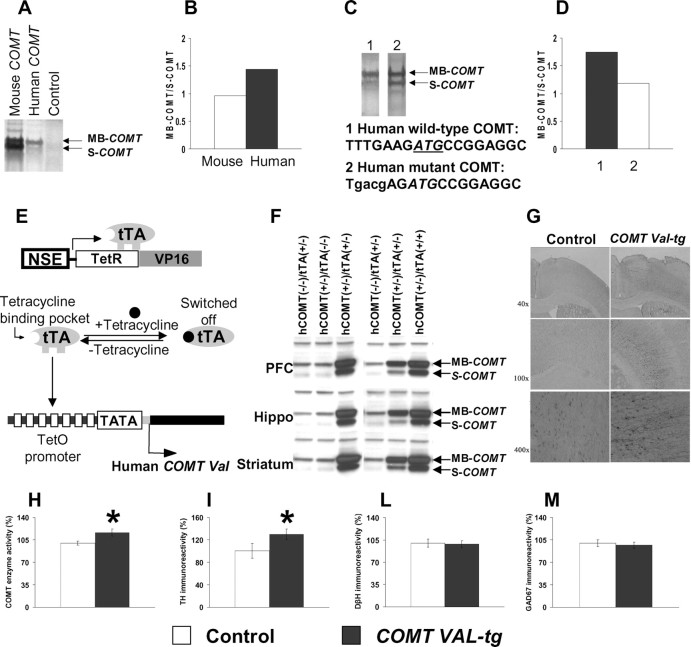
Gene divergence Kozak mutation and generation of transgenic mice overexpressing the human COMT-Val gene. A, MB-COMT and S-COMT proteins were generated by in vitro protein synthesis using 35S-methionine as labeling substrate and mouse and human COMT cDNAs as templates. B, Ratio of the MB-COMT versus S-COMT proteins. C, MB-COMT and S-COMT proteins were generated as above and using human wild-type and Kozak mutant COMT cDNAs as templates. D, Mutation at the Kozak sequence of human COMT cDNA decreased the ratio of the MB-COMT versus S-COMT proteins. E, Schematic diagram of a tetracycline-regulated gene expression system. Neuron-specific expression of tTA containing the tetracycline binding domain from the tetracycline receptor (TetR) and transactivation domain from the viral transcription factor VP16 is driven by the NSE promoter. The tTA can bind to the tetracycline-responsive promoter, which contains TetO and minimal CMV promoter carrying only TATA box to activate the expression of the human COMT-Val transgene. Expression of the transgene can be switched off by tetracycline. F, Expression of human COMT-Val protein in the frontal cortex, hippocampus, and striatum of mice carrying the NSE-tTA alone [hCOMT(−/−)/tTA(+/−)], the human COMT-Val transgene alone [hCOMT(+/−)/tTA(−/−)], or both transgenes [hCOMT(+/−)/(tTA+/−) or (tTA+/+)]. G, Overexpression of the COMT gene was restricted to neurons and the major cell type expressing the human COMT-Val-tg was pyramidal neurons. Neurons expressing the COMT-Val-tg were detected by immunostaining with specific anti-human COMT antibody. H, COMT enzyme activity in the frontal cortex of the COMT-Val-tg mice and their controls. n = 17–21 per group. *p < 0.05 versus control mice. I–M, Immunoreactivity of (I) TH, (L) DβH and (M) GAD67 proteins in the frontal cortex of the COMT-Val-tg mice and their controls. n = 4–9 per group. Results are expressed as percentage over the average of the control group. Values represent mean ± SEM. *p < 0.05 versus control mice.

