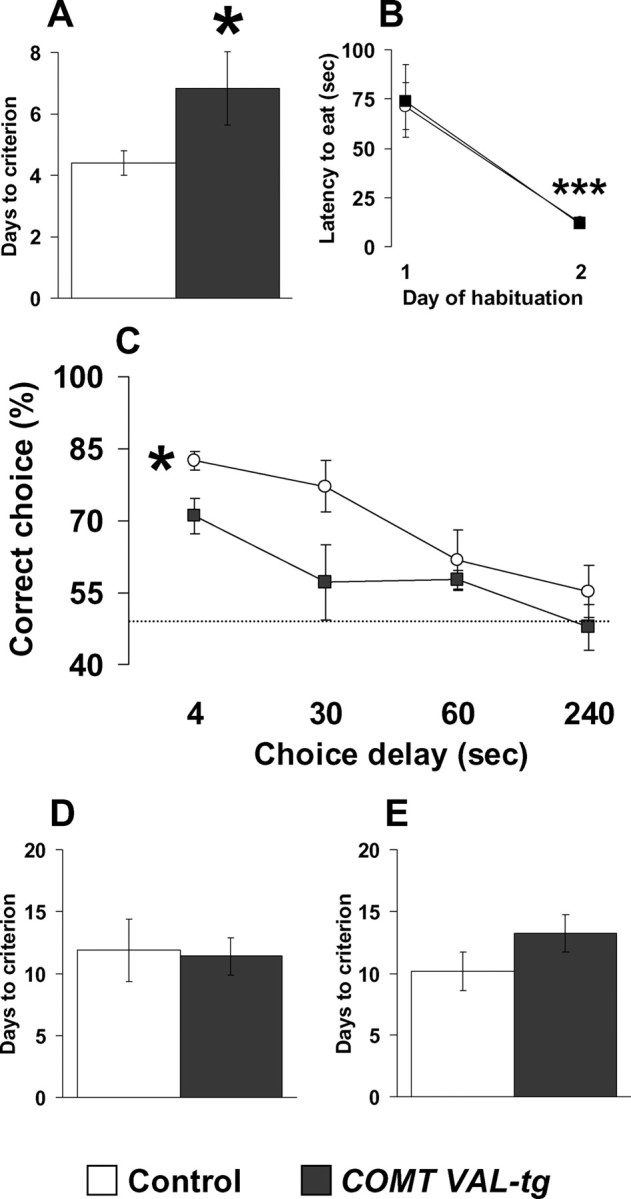
Figure 4.

Specific working memory impairments in COMT-Val-tg mice. A, B, Days needed to reach the criteria (A) and latency to retrieve the hidden food pellet displayed by control and COMT-Val-tg mice during the discrete paired-trial T-maze task (B). n = 6–10 per group. *p < 0.05 versus control mice; ***p < 0.0001 versus day 1 of the habituation. C, Percentage of correct choices displayed by control and COMT-Val-tg mice during the discrete paired-trial variable-delay T-maze task with different intratrial delays randomly presented (4, 30, 60, and 240 s) and an intertrial delay of 20 s. The dotted line corresponds to chance levels (50%) of correct choices. n = 6–10 per group. *p < 0.01 versus control mice. D, E, Days needed to reach the criteria displayed by control and COMT-Val-tg mice during the continuous spatial alternation T-maze task (D; n = 8–15 per group) and during the reversal phase (E; n = 7–13 per group). Values represent mean ± SEM.
