
Figure 2. Temporal coincidence of ADK overexpression and development of spontaneous seizures.
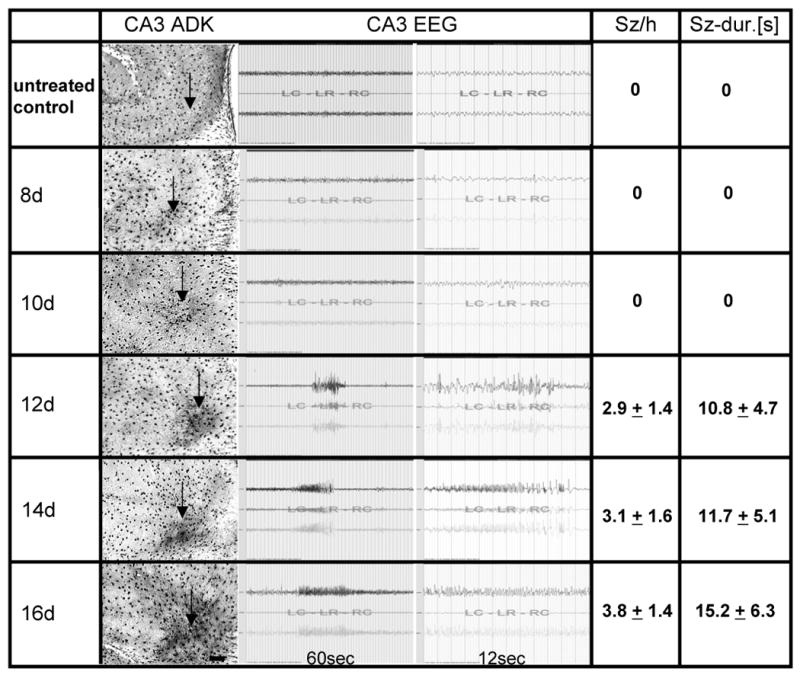
Ten wild type mice received intraamygdaloid injections of KA and received CA3 recording electrodes at the day of KA-injection. Five wild type control animals not injected with KA were included as control (top row: “untreated control”). All animals were EEG-monitored daily to detect the first onset of spontaneous seizures. Two animals each were processed for ADK immunohistochemistry at 8, 10, 12, 14, and 16 days (8d – 16d) after KA-injection. The column “CA3 ADK” shows representative brain sections (electrode insertion level not shown, but approximated by arrows) with ADK immunoreactivity visualized with DAB. Note the first emergence of significant ADK upregulation at day 12; scale bar 100 μm. Representative CA3 EEG traces are shown, demonstrating lack of seizures at day 8 and 10, but emergence of spontaneous CA3 seizures from day 12 onwards. Quantitative data are given as average number of seizures per hour (Sz/h) and average duration of each seizure in seconds (Sz-dur.[s]). Seizure data are based on n = 10 for day 8, n = 8 for day 10, n = 6 for day 12, n = 4 for day 14, and n = 2 for day 16.