
Figure 4. Epilepsy associated cell loss.
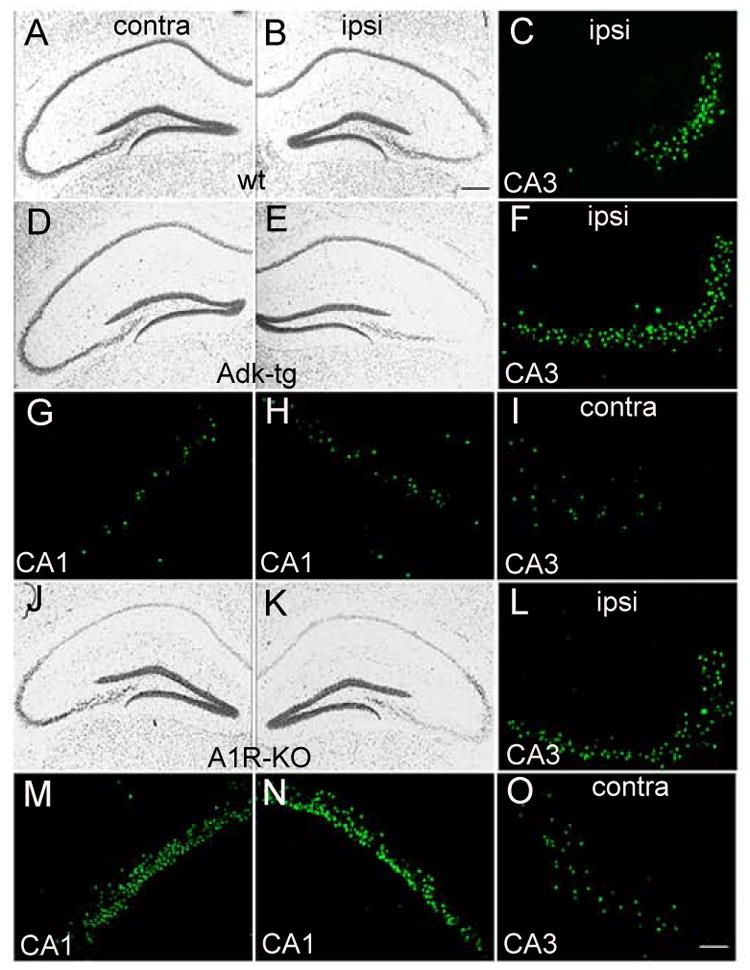
Representative micrographs of the hippocampal formation from coronal brain sections taken from wild type mice (wt) (A-C), Adk-tg mice (D-I), and A1R-KO mice (J-O) 24 h after intraamygdaloid injection of 0.3 μg KA. Sections were stained either with cresyl violet or with TUNEL (green). (A-C) Typical apoptotic cell death in the CA3 region of the hippocampus of wt mice ipsilateral (ipsi) to the KA-injected amygdala. (D-I) Adk-tg mice show aggravated cell loss in the ipsilateral CA3 region (F), and novel cell loss in the ipsilateral CA1 region (H), and the contralateral CA1 (G) and CA3 (I) regions. (J-O) A1R-KO mice show aggravated cell loss in the ipsilateral CA3 region (L), and novel cell loss in the ipsilateral CA1 region (N), and the contralateral CA1 (M) and CA3 (O) regions. Scale bars: A,B,D,E,G,H,J,K,M,N: 100 μm; C,F,I,L,O: 25 μm.