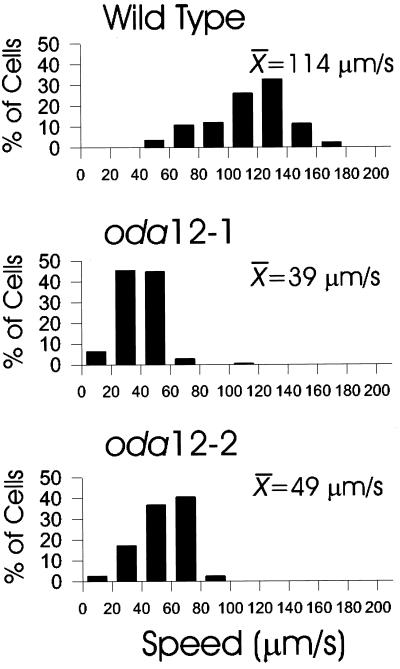
Figure 4.
Swimming speed of wild-type and oda12 mutant cells. The Speed Operator of the ExpertVision Motion Analysis system was used to calculate the swimming speed of individual cells. The histograms show the distribution of speeds within each sample. These are plotted as the percentage of cells in each of 10 20-μm/s bins between 0 and 200 μm/s. The mean swimming speed (in micrometers per second) for each sample also is shown. Note that the mean swimming speed of oda12-2 cells (49 μm/s) is slightly faster than that of oda12-1 cells (39 μm/s). More than 100 cells were analyzed for each cell type.

