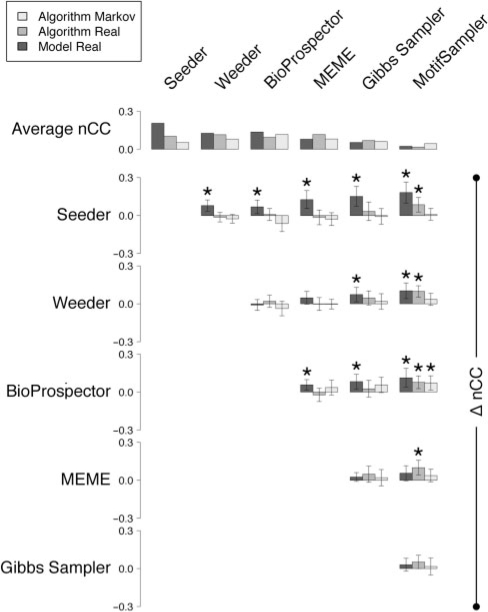
Fig. 2.
Average benchmarking scores and pairwise differences between motif discovery tools. Average nucleotide-level Pearson correlation coefficient (nCC) and pairwise differences (Δ nCC) for six motif discovery tools tested on three benchmark suites. Error bars correspond to 95% confidence intervals. Stars indicate significant differences (α=0.05) between scores.

