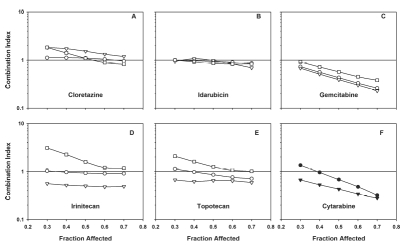
Figure 3.
Combination index plots of Chou-Talalay and impact of drug sequence in HL-60 cells. Composite dose-response curves were constructed for drugs alone and in combination as described in Methods. The respective fraction affected (Fa) was interpolated at 10 percent Intervals and the values used to compute the combination index for simultaneous administration of CP-4055 (open circles), for CP-4055 given 24 h prior to (open triangles) or 24 h after (open squares) the second drug in the combination listed in each panel. For cytarabine, only simultaneous combinations are shown combined with CP-4055 (closed circles), and with gemcitabine (closed triangles).

