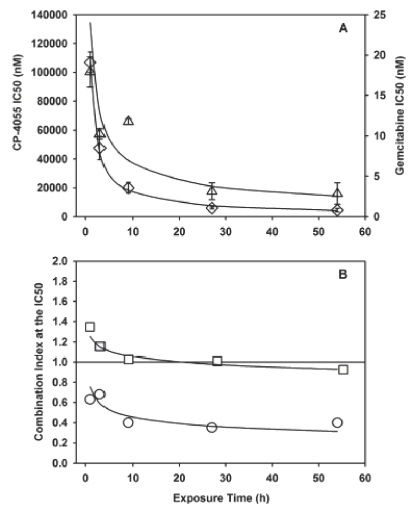
Figure 7.
Effect of exposure time on the interaction of CP-4055 plus gemcitabine. Panel A: IC50 versus exposure time in HL-60 cells Is shown for CP-4055 (diamonds) and gemcitablne (triangles) as single agents. Panel B: HL-60 (circles) or U937 (squares) cells were exposed simultaneously to CP-4055 in combination with gemcitabine at a fixed ratio of 1:0.0025 or 1:0.02, respectively. The combination index at the IC50 level of effect was then determined at each indicated time point. Bars: intra-assay standard error; lines: fit of data to the pharmacodynamic model Cn × T = k.

