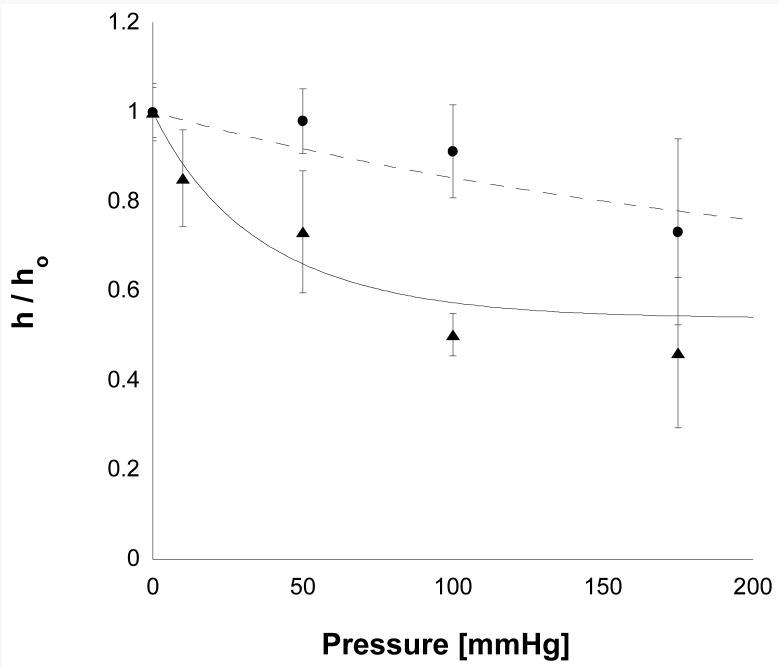
Figure 5.
The compaction ratio (h/h0) as a function of perfusion pressure for 1% Matrigel (triangles, 9.7 mg/ml) and for 2% Matrigel (circles, 20.2 mg/ml). Error bars are standard deviations (n varied between 4 and 8). The solid line and the dashed lines are the best fits of Eq. (13) to these data.

