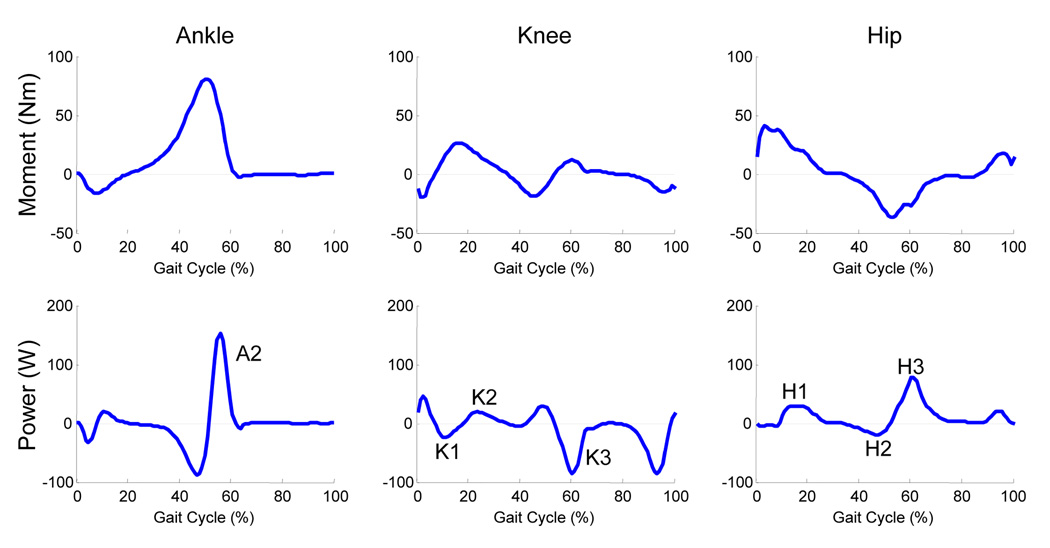
FIGURE 2. Moment and power data for the left leg of a single representative subject.
Data are normalized from left heel strike to left heel strike. All major moment and power peaks were calculated for prescribed phases of the gait cycle keeping with previous convention (Winter, 1983). Ankle plantar flexion, knee extension and hip extension moments are positive. A2 represents ankle plantar flexion power during late stance. K1, K2, and K3 represent knee extension power, both absorption (negative) and generation (positive), during early stance, midstance and terminal stance respectively. H1 represents hip extension power while H2 and H3 represent hip flexion power.

